
[ad_1]
Why Are Google Analytics SEO Reports Important?
Google Analytics (GA4) is a comprehensive web analytics tool that helps you monitor website performance, content engagement, and traffic trends.
The tool collects user engagement data and then makes the data available for analysis in over 20 reports.
While not a purpose-built platform for organic search, GA4 has some reports that are perfect for SEO analysis. They help you measure SEO traffic trends, uncover SEO issues for you to fix, and identify opportunities to improve your content.
Let’s review some essential Google Analytics SEO report types, their key metrics, and insights. You’ll also learn how to create an additional custom SEO report.
Traffic Acquisition Report
Google Analytics’ traffic acquisition report tells you how many visits come from organic search compared to other traffic channels.
You can see how engaged those visits are, and how they lead to conversions (the most valuable customer interactions, like a purchase on an ecommerce site or a form submission on a B2B site).
Further reading: Google Analytics for Beginners: Getting Started with GA4
Here’s how to get there.
Go to “Reports” in the left-hand navigation.
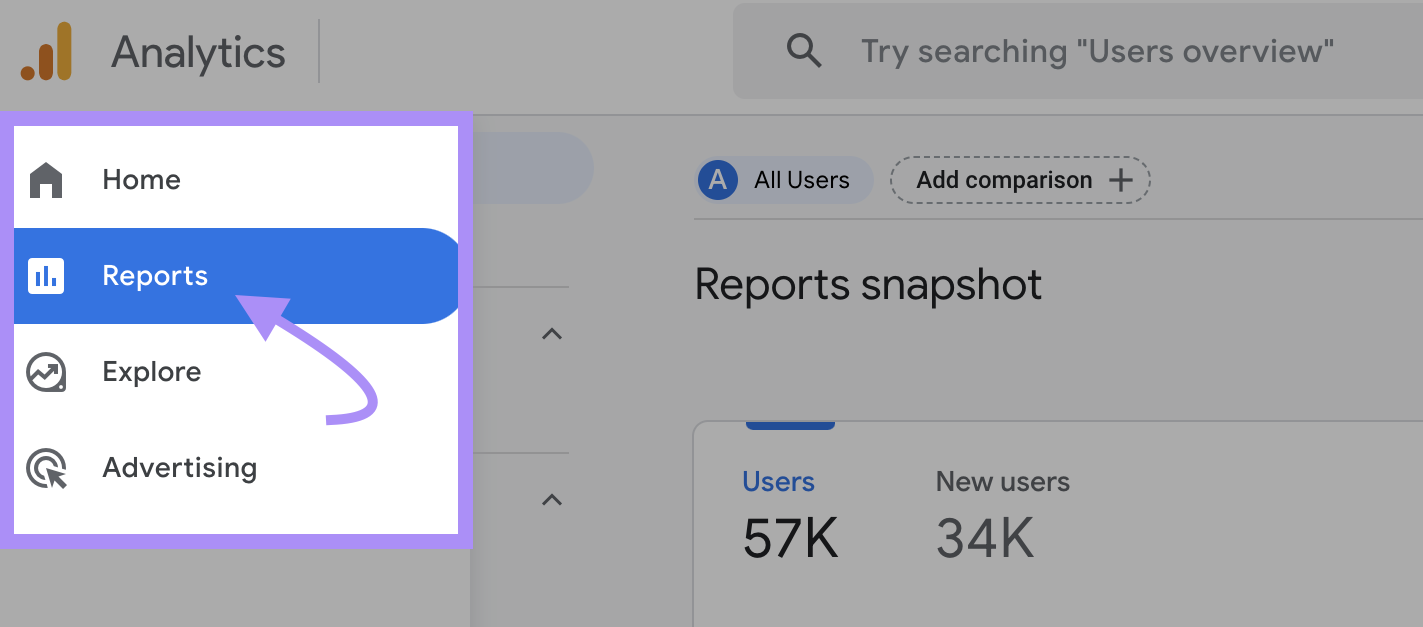
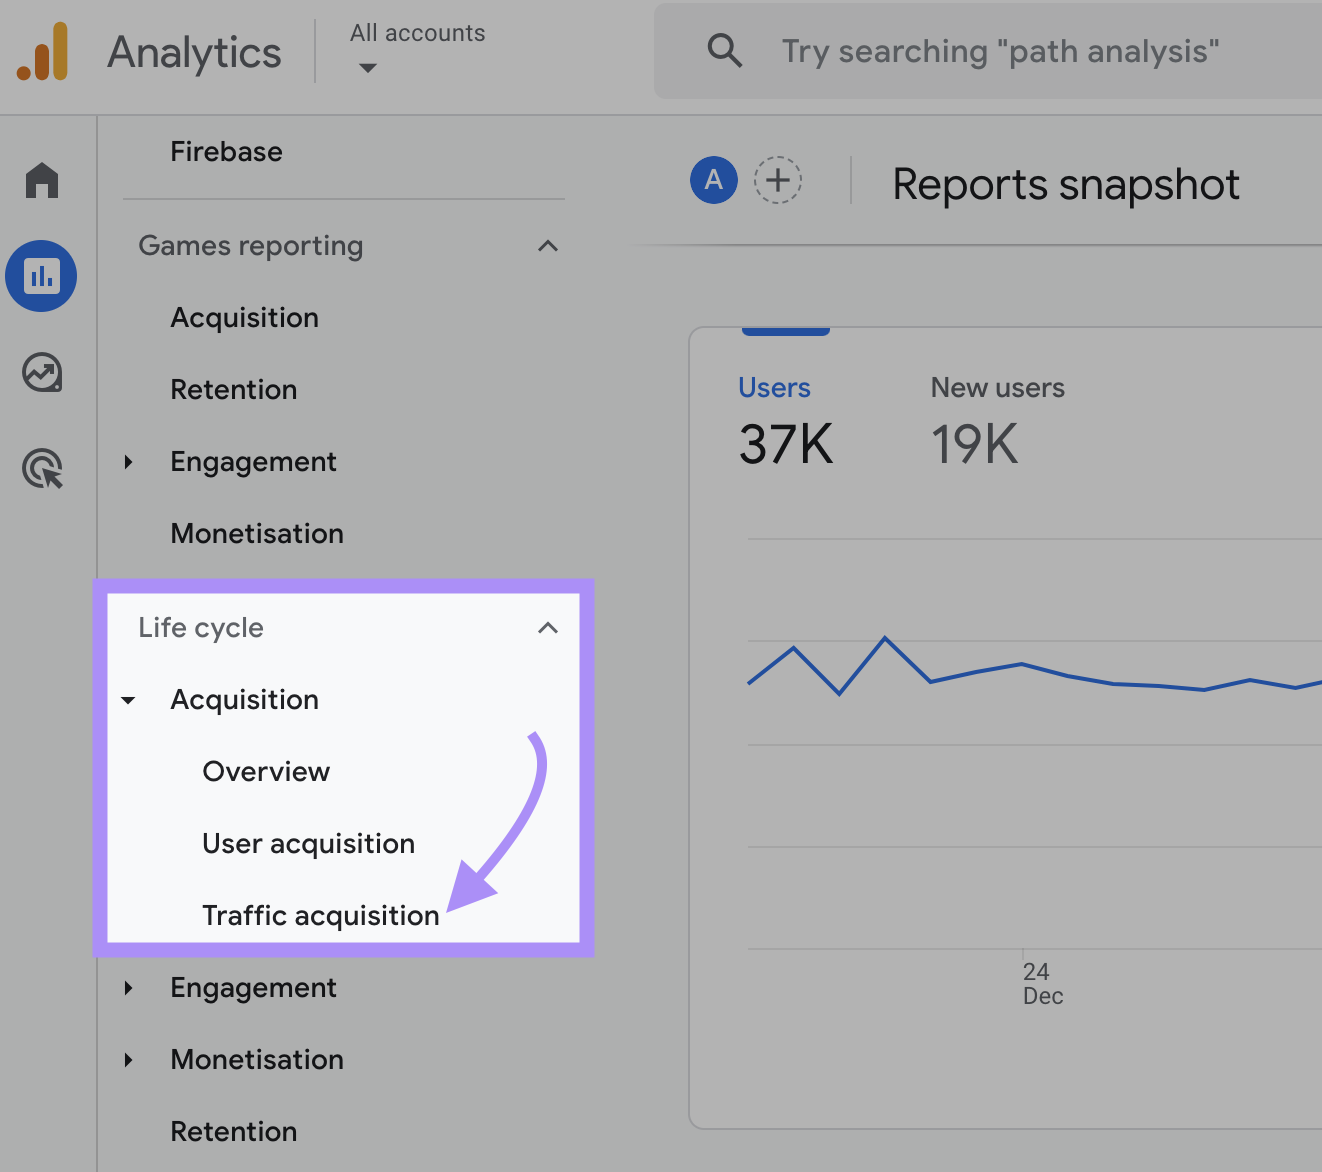
Click on “Acquisition” from the “Life cycle” reporting section. Then, select “Traffic acquisition” from the drop-down.
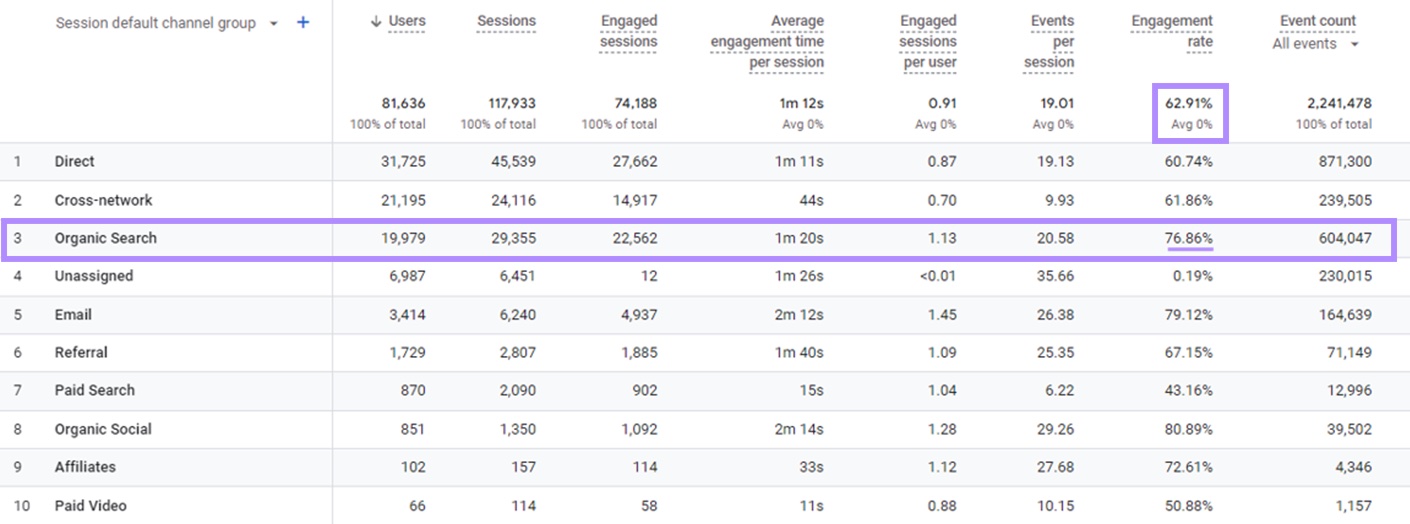
You’ll see a report dashboard that looks like this:
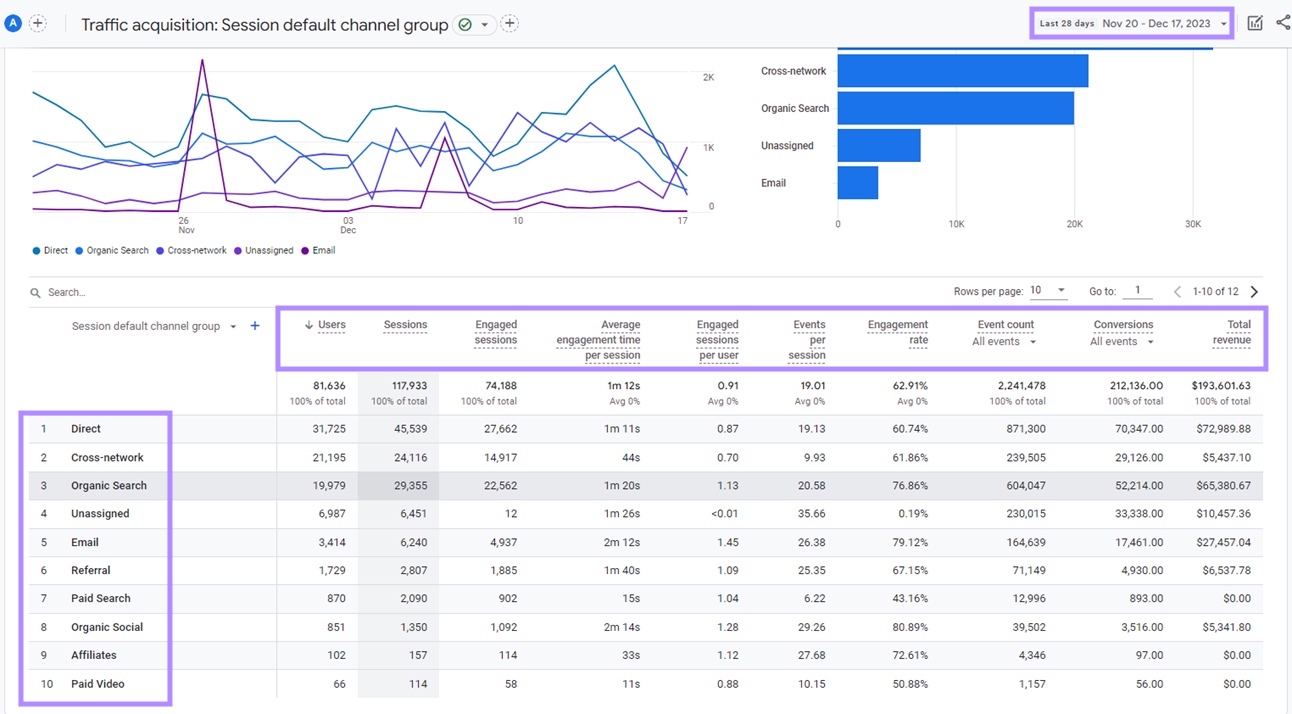
Showing you metrics like users, sessions, and conversions for all your traffic channels.
By default, the report covers the last 28 days. Click on the date range selector in the upper right corner to analyze a specific time frame.
Next, we outline four critical SEO questions the traffic acquisition report can help you answer. We’ll use the same data from the above reporting dashboard for each.
How Important Is Organic Search for Your Site?
Studies have shown that organic search represents more than half of all trackable online traffic. That’s a lot of website visitors acquired for free through search engines like Google.
Now you know how important your organic traffic is compared to your overall traffic, you can use Google Analytics to see how your site compares to the above.
Further reading: What Is Organic Traffic in Google Analytics 4? (+ Analysis Tips)
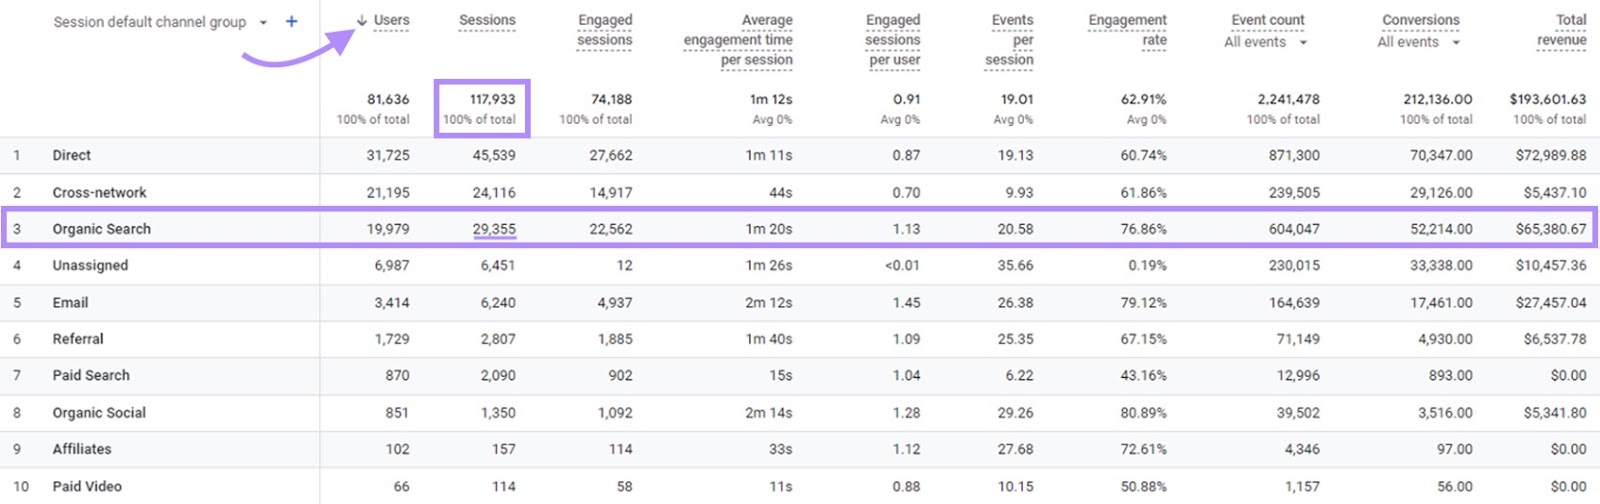
In our example report, we see that organic search accounts for 24.9% of all sessions (visits) on the site (29,355 / 117,933).
How Engaged Is Organic Search Traffic?
Google Analytics’ engagement rate metric can tell you how interested your organic search visitors are in your content.
A visit (or “session”) counts as engaged when at least one of the following three conditions is true:
- The user views more than one page
- The user spends at least 10 seconds actively engaging with a single page
- The user completes a conversion action
All are signals that a visitor is finding valuable information. And likely getting closer to a conversion (or already converted).
The number of engaged sessions relative to the total number of sessions yields the engagement rate.
Our report shows that organic search has an engagement rate of 76.86% compared to the site average of 62.91%.
How Well Does Organic Traffic Generate Conversions?
Take a look at the “Total revenue” column.
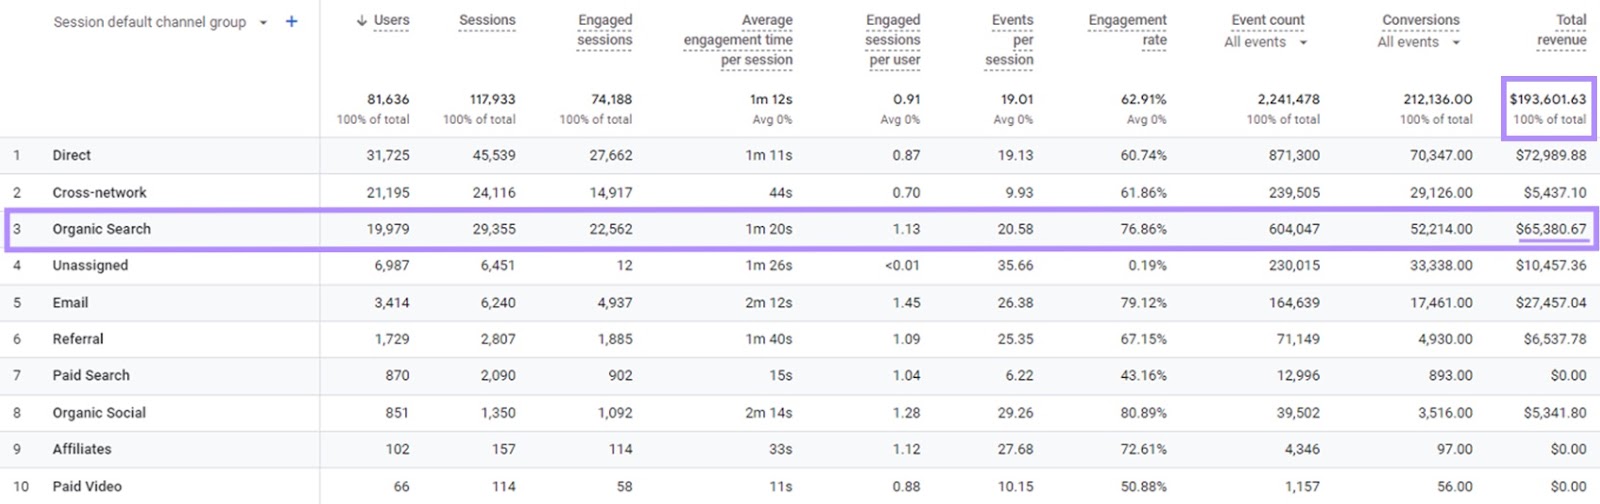
We calculate that organic search in this case generates 33.7% of all revenue ($65,380.67 / $193,601.63). Driving more than a third of revenue while accounting for less than a quarter of the site visits.
You can now make a compelling case to your management team for investing more in SEO. Showing it could be an opportunity for business growth.
Landing Page Report
A landing page is the page where a session begins on a website. You can use a landing page report filtered to organic search traffic to see which pages drive SEO visits to your site.
The data you find there will help you better understand your content performance.
With this type of SEO report, Google Analytics can help you identify pages for to optimize.
So, what types of pages should you look for as optimization candidates? Here are three types:
- High-traffic pages: Focus on improving those pages that already get the most SEO visits. These have the potential to lift your total traffic the most if they can get even better.
- Low-traffic pages that are new, detailed, and well-written: Sometimes, new content doesn’t do well and needs updating before it climbs in the search engine results pages (SERPs). Keep an eye out for these pages that might need some tweaks for the best chance to perform.
- Pages that have significant declines in traffic: Some SEO content tends to decay over time. Look for declining traffic to spot pages that would benefit from a content refresh or other tweaks to help you recapture what you’ve lost.
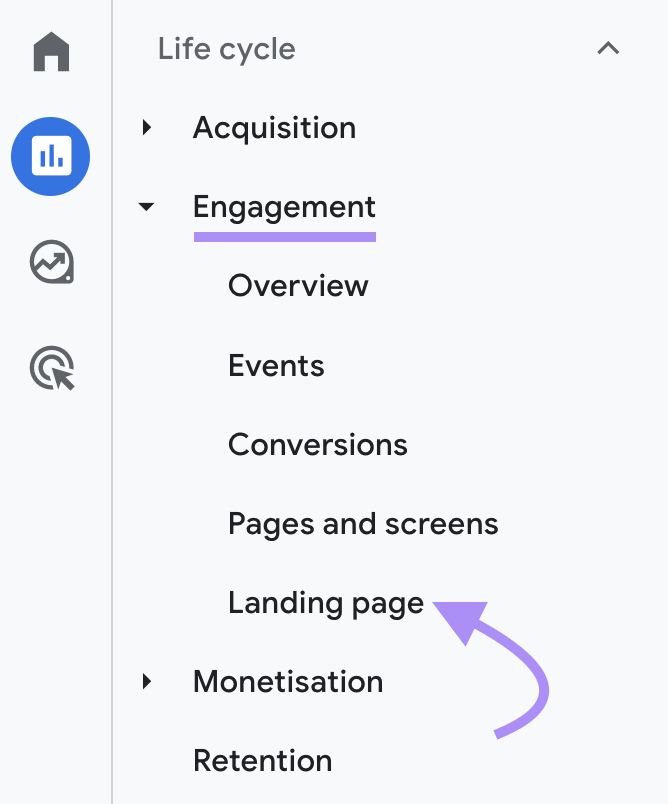
To identify these kinds of pages, click on the “Engagement” drop-down in the “Life cycle” reports section. Then, click on “Landing page” to access the report.
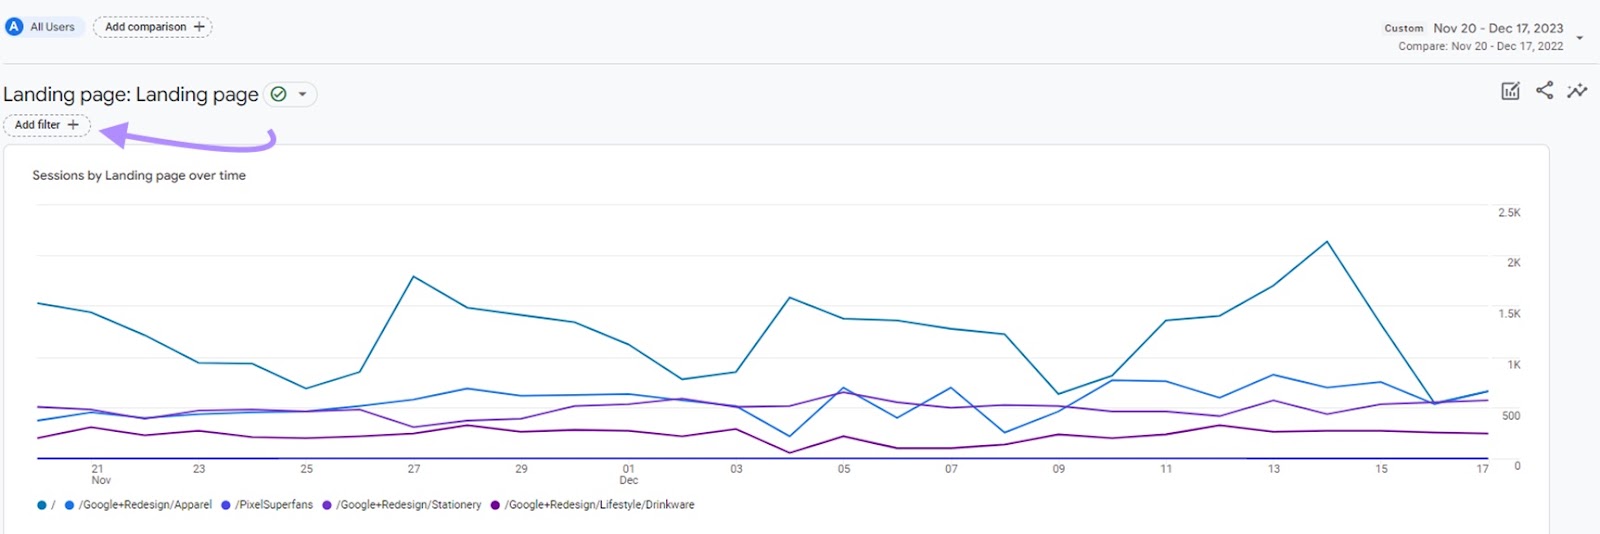
You’ll see a data table with your top landing pages sorted in descending order, based on how many visits they receive. You’ll also see a graph of those pages immediately above it.
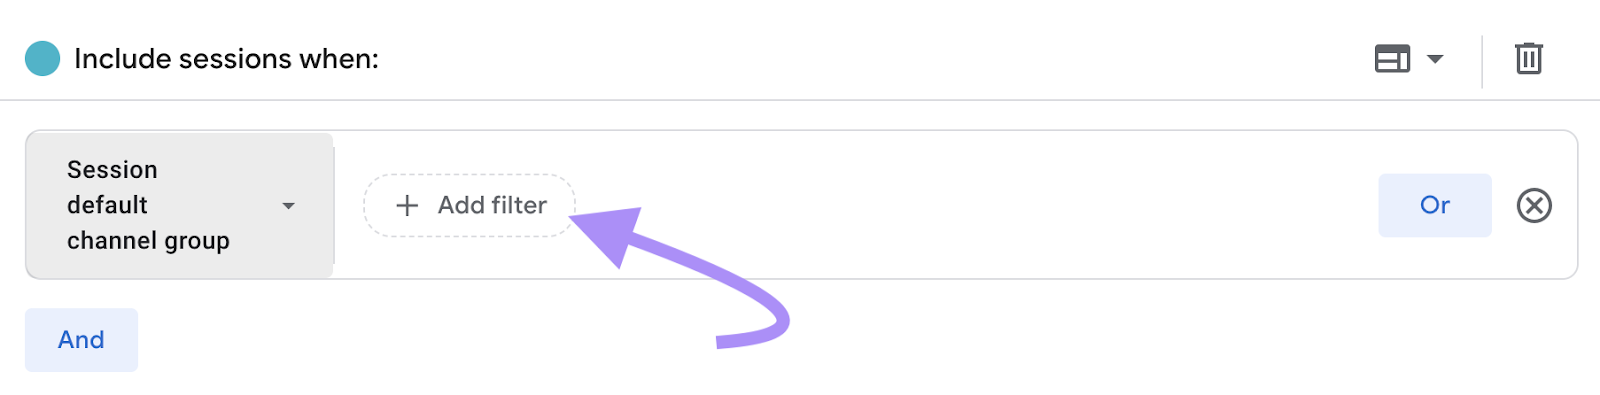
By default, the report will show all traffic sources. To view only organic search traffic, click the “Add filter” button to the left of the screen—below the landing page title.
You’ll now be able to add a filter to set the conditions of the data you’re viewing. You’ll use what’s called a dimension to make it happen.
Important: Google Analytics data consists of both metrics and dimensions. Metrics are quantitative values. Dimensions are attributes that organize and describe the data.
In this case, you want to see the total number of sessions (the metric) broken down by the specific landing page where the session began (the dimension). And you want to limit the report to only the “Organic Search” traffic channel.
First, click on the “Select dimension” field. Begin typing “Session default channel group” and select it from the drop-down.
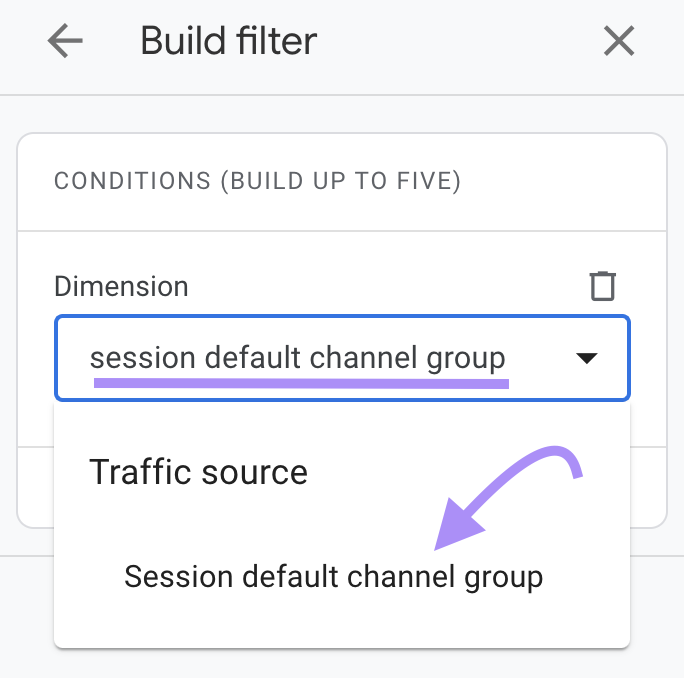
Session default channel group is one of the ways you can analyze your Google Analytics traffic sources. Allowing you to group all organic search traffic.
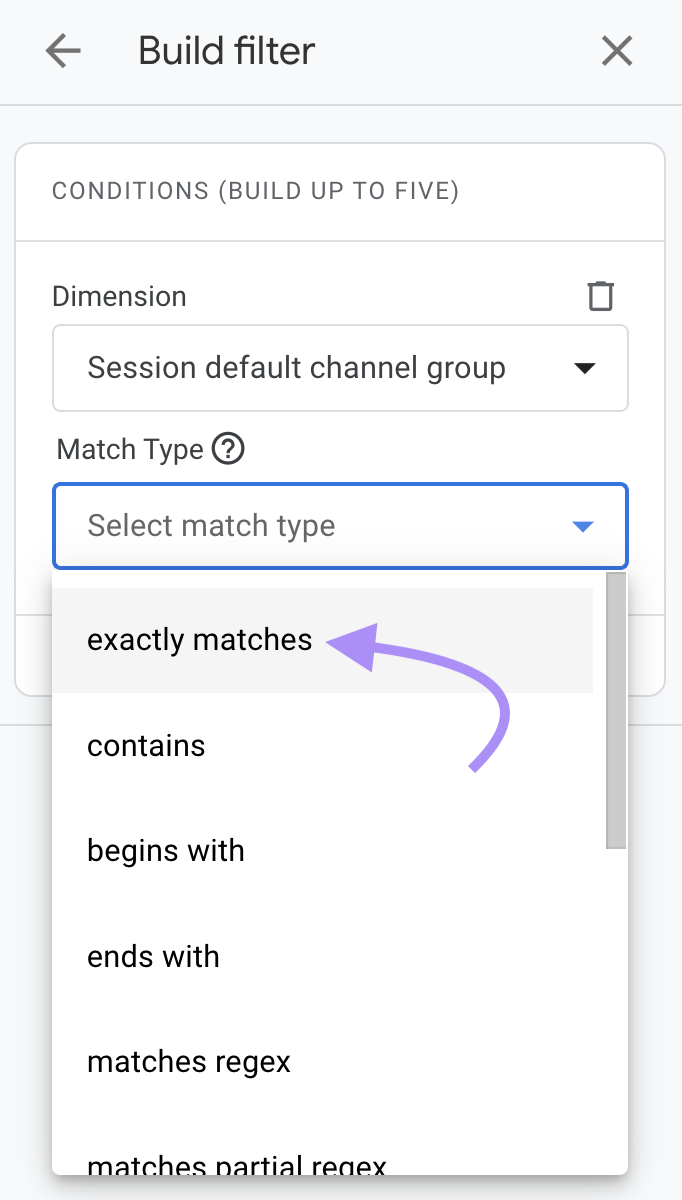
Now, click into the field under the “Match Type” heading. You’ll get a list of options for matching your filter. Choose “exactly matches.”
A new field called “Value” will appear. Click into its drop-down list to select the dimension value. Select the “Organic Search” checkbox.
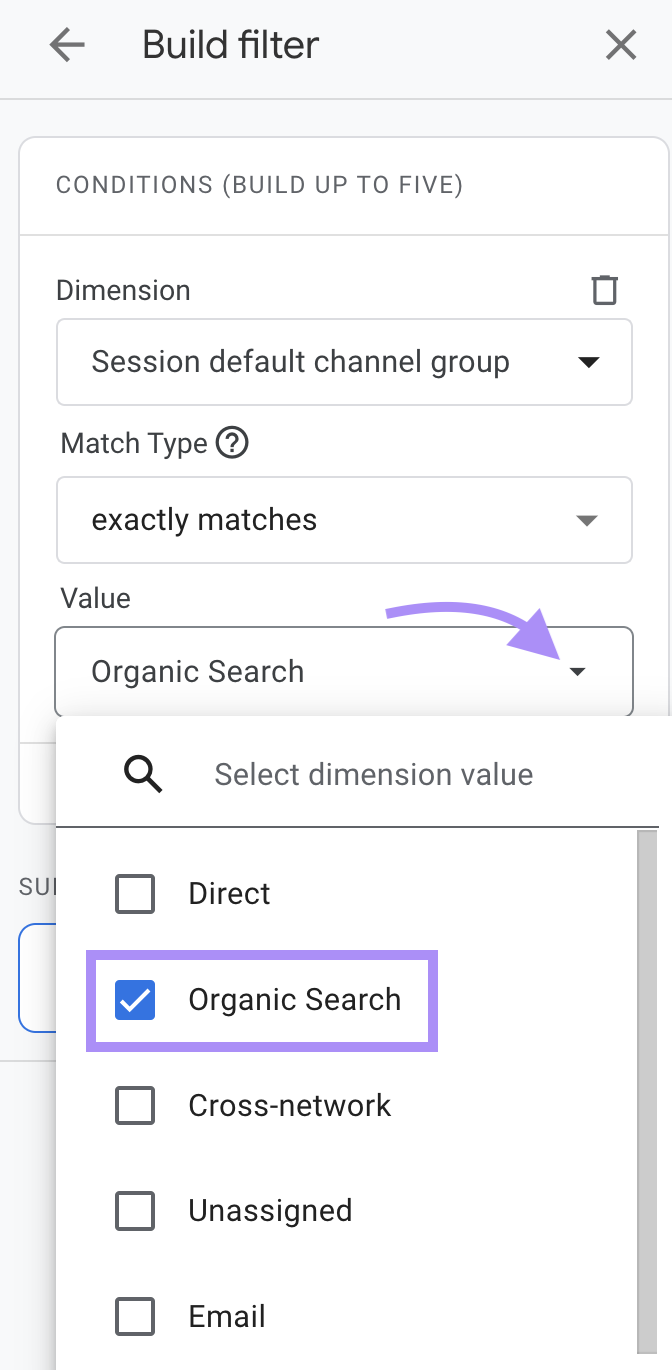
Then click the blue “Apply” button.
You’re now looking at the landing page report filtered to only organic search results.
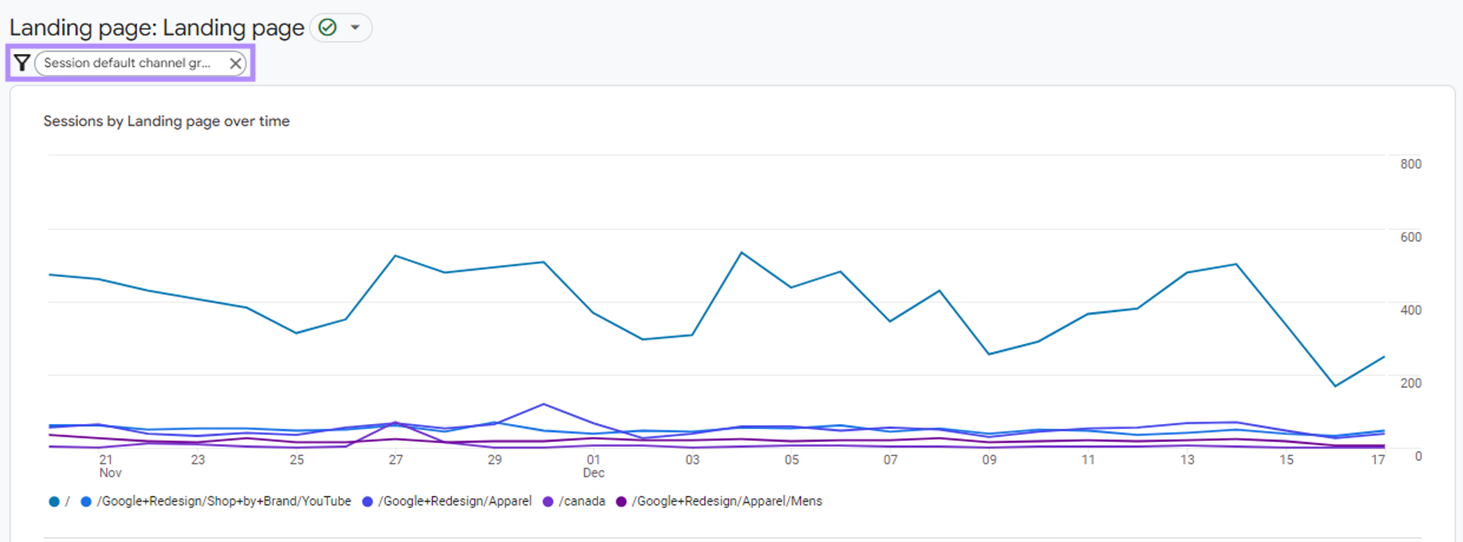
With the filter on, you can spot some page-level issues that indicate a declining performance.
The data table below shows a page where traffic has increased but revenue has dropped by over 78%.
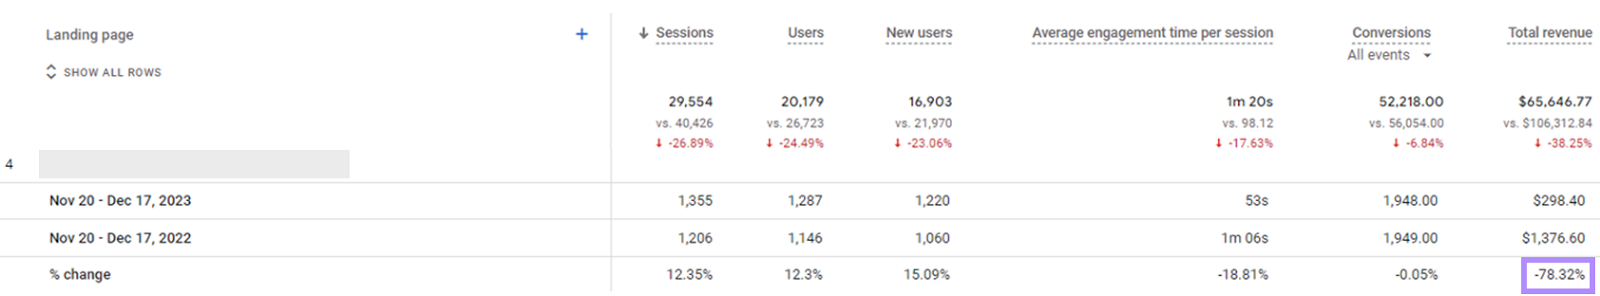
Make a note to review the page functionality and design of this URL. Is it possible something is not working on the page? Or has a recent design change made it harder for your visitors to convert?
You can also spot some pages where traffic from organic search has declined by as much as 83.27%.
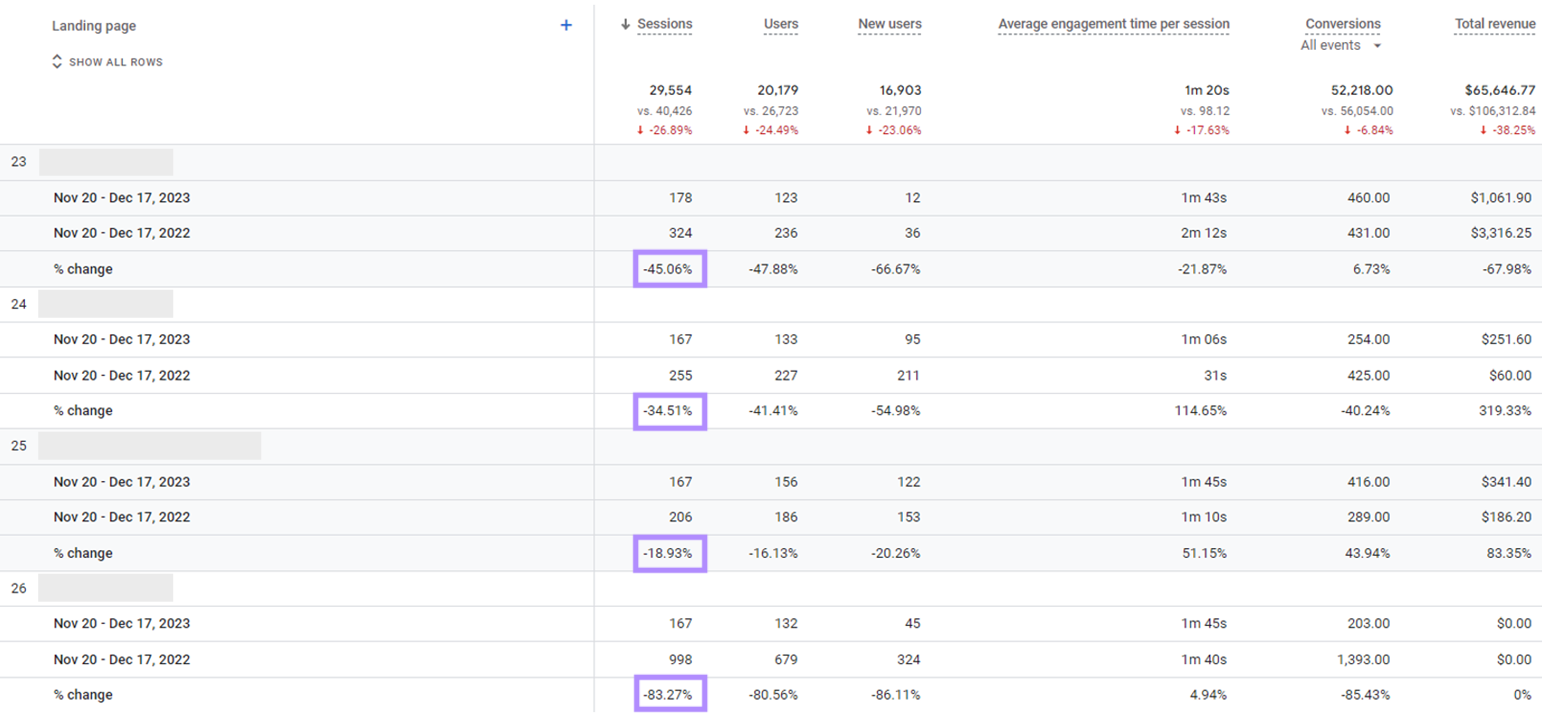
Plan to review each one so no critical SEO issues are holding them back.
You can use a tool like Site Audit to help you fix page-level SEO errors. Here’s a full list of issues it can identify.
Search Console Queries Report
Google Analytics 4 integrates with Google Search Console for Google-specific SEO insights.
If you’ve set up the integration, you’ll see the “Search Console” reporting area in your Google Analytics reports. Which you can use to analyze keyword-level performance.
Keywords (or “search queries”) are specific terms visitors look for on Google or other search engines to get information on a particular topic. Using keywords in your webpage content can help you rank at the top of Google’s results for those same keywords.
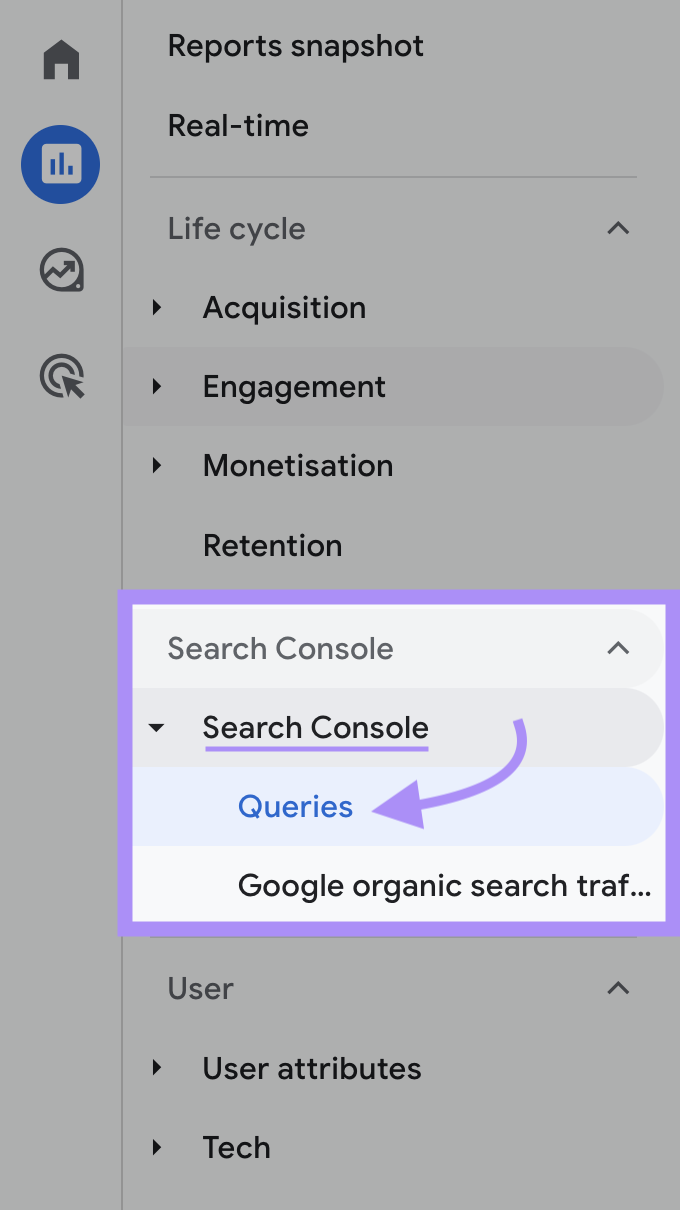
Click on “Search Console” and then the “Queries” report to see the specific keywords your site ranks for.
You will get a list of your top 10 keywords based on organic clicks from Google Search. To see more keywords, click the drop-down arrow next to “Rows per page” to view 25, 50, 100, or 250 rows per page.
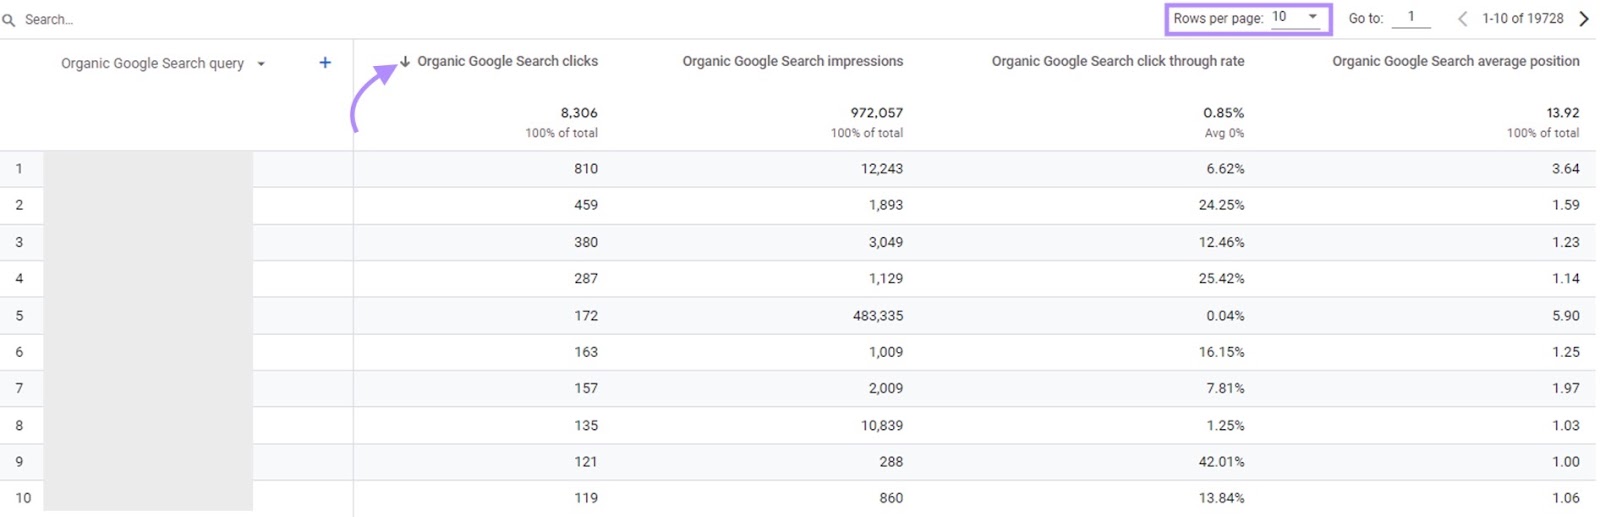
Look for keywords where your ranking (“Organic Google Search average position”) and click volume (“Organic Google Search clicks”) have both declined. You can then plan a content refresh targeting these low-performing keywords to improve your site’s SEO performance.
Further reading: SEO Ranking: Factors & Tips to Improve Your Positions
404 Error Report
You can also investigate some technical issues with SEO reports in Google Analytics. Like finding 404 errors using the “Pages and screens” report to help you fix your broken links.
A 404 error occurs on your site when a visitor tries to access a page that can’t be found. It’s a poor experience for human visitors. And search engines don’t like them for the very same reason.
Errors like these commonly occur with broken links. Which can occur when a page gets deleted, a URL changes, or if there was a mistake in creating the original link.
Here’s how to diagnose those problem areas so you can fix them.
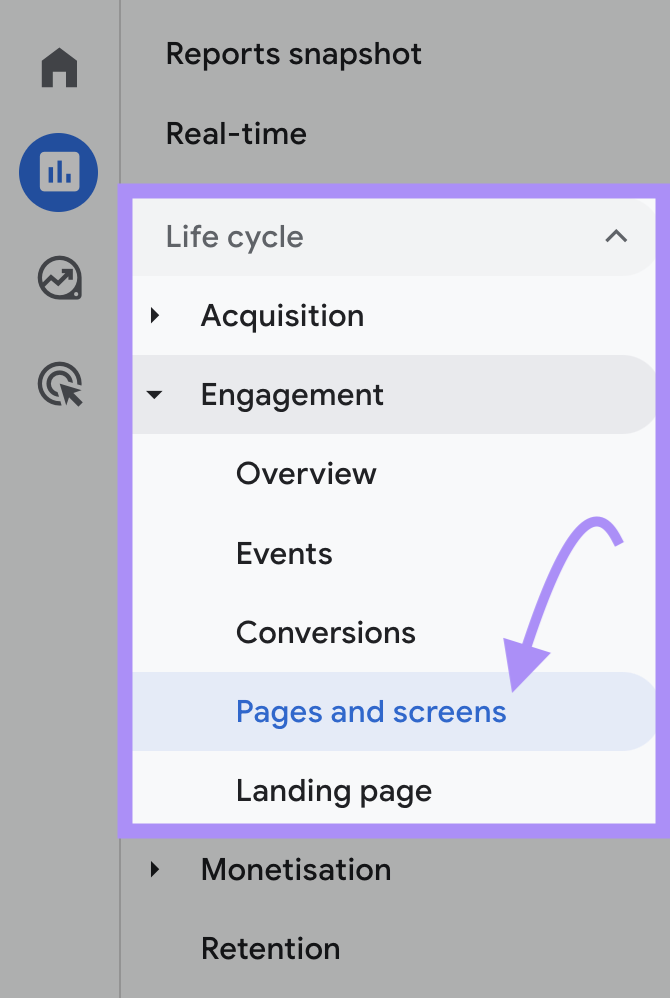
Click on “Pages and screens” under “Life cycle” > “Engagement.”
Change the primary dimension by clicking the small dropdown arrow to the right of “Page path and screen class.”
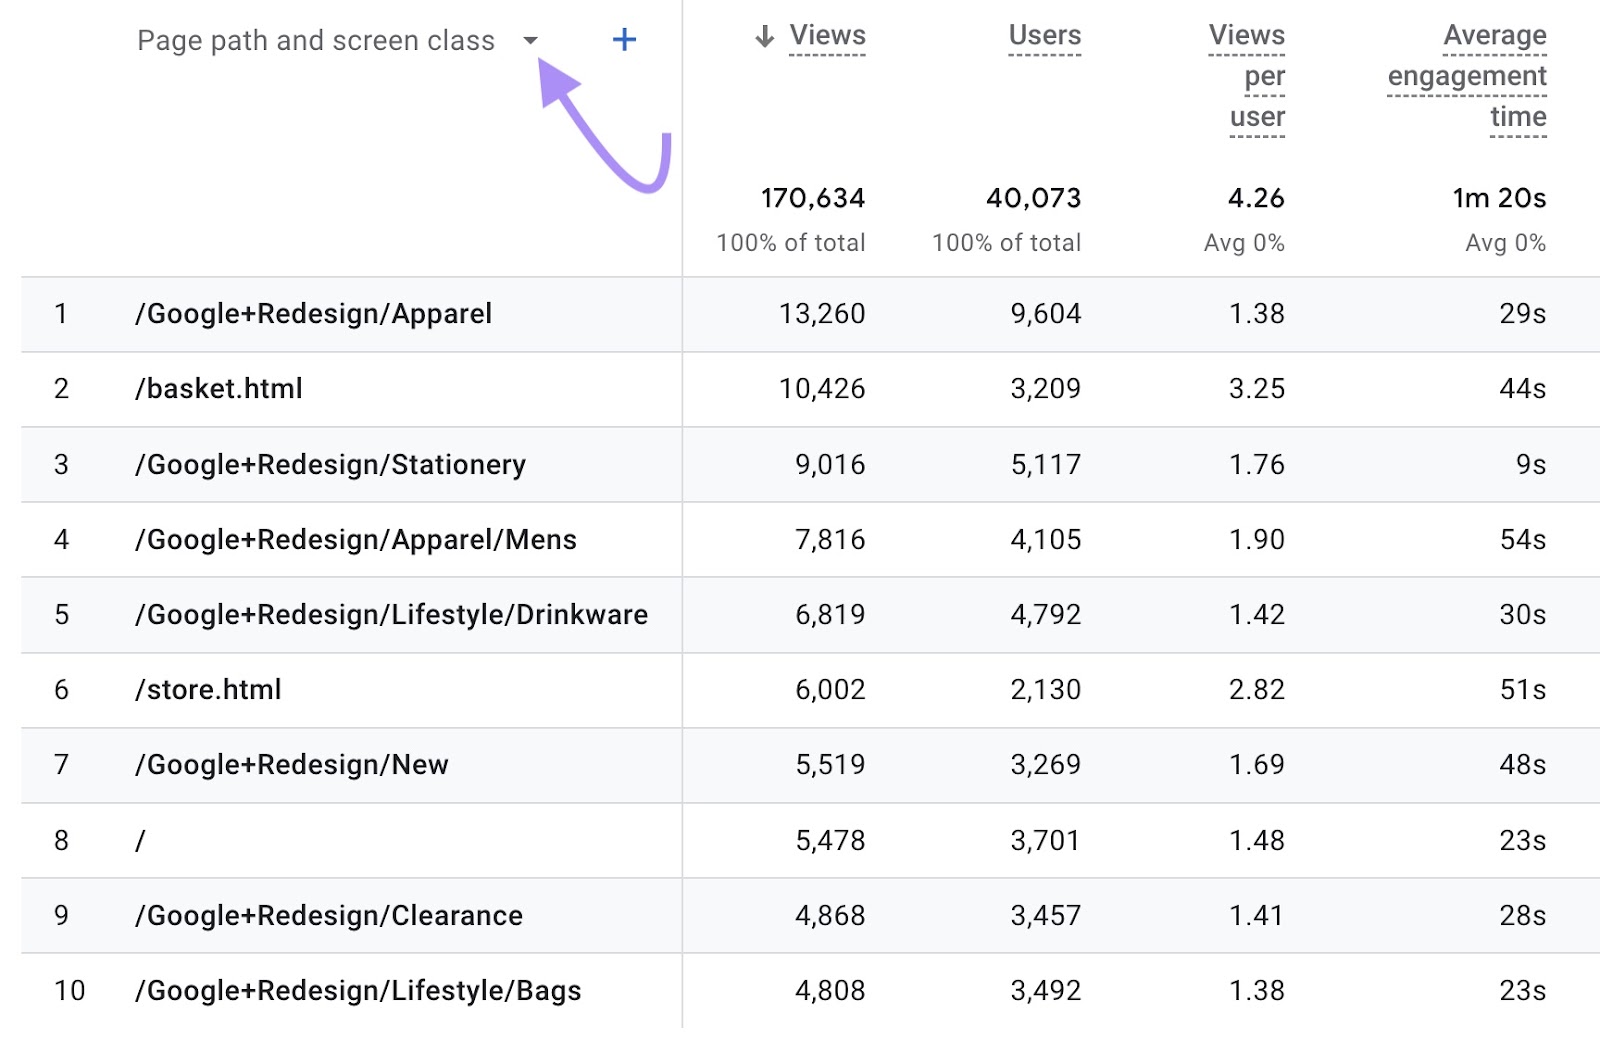
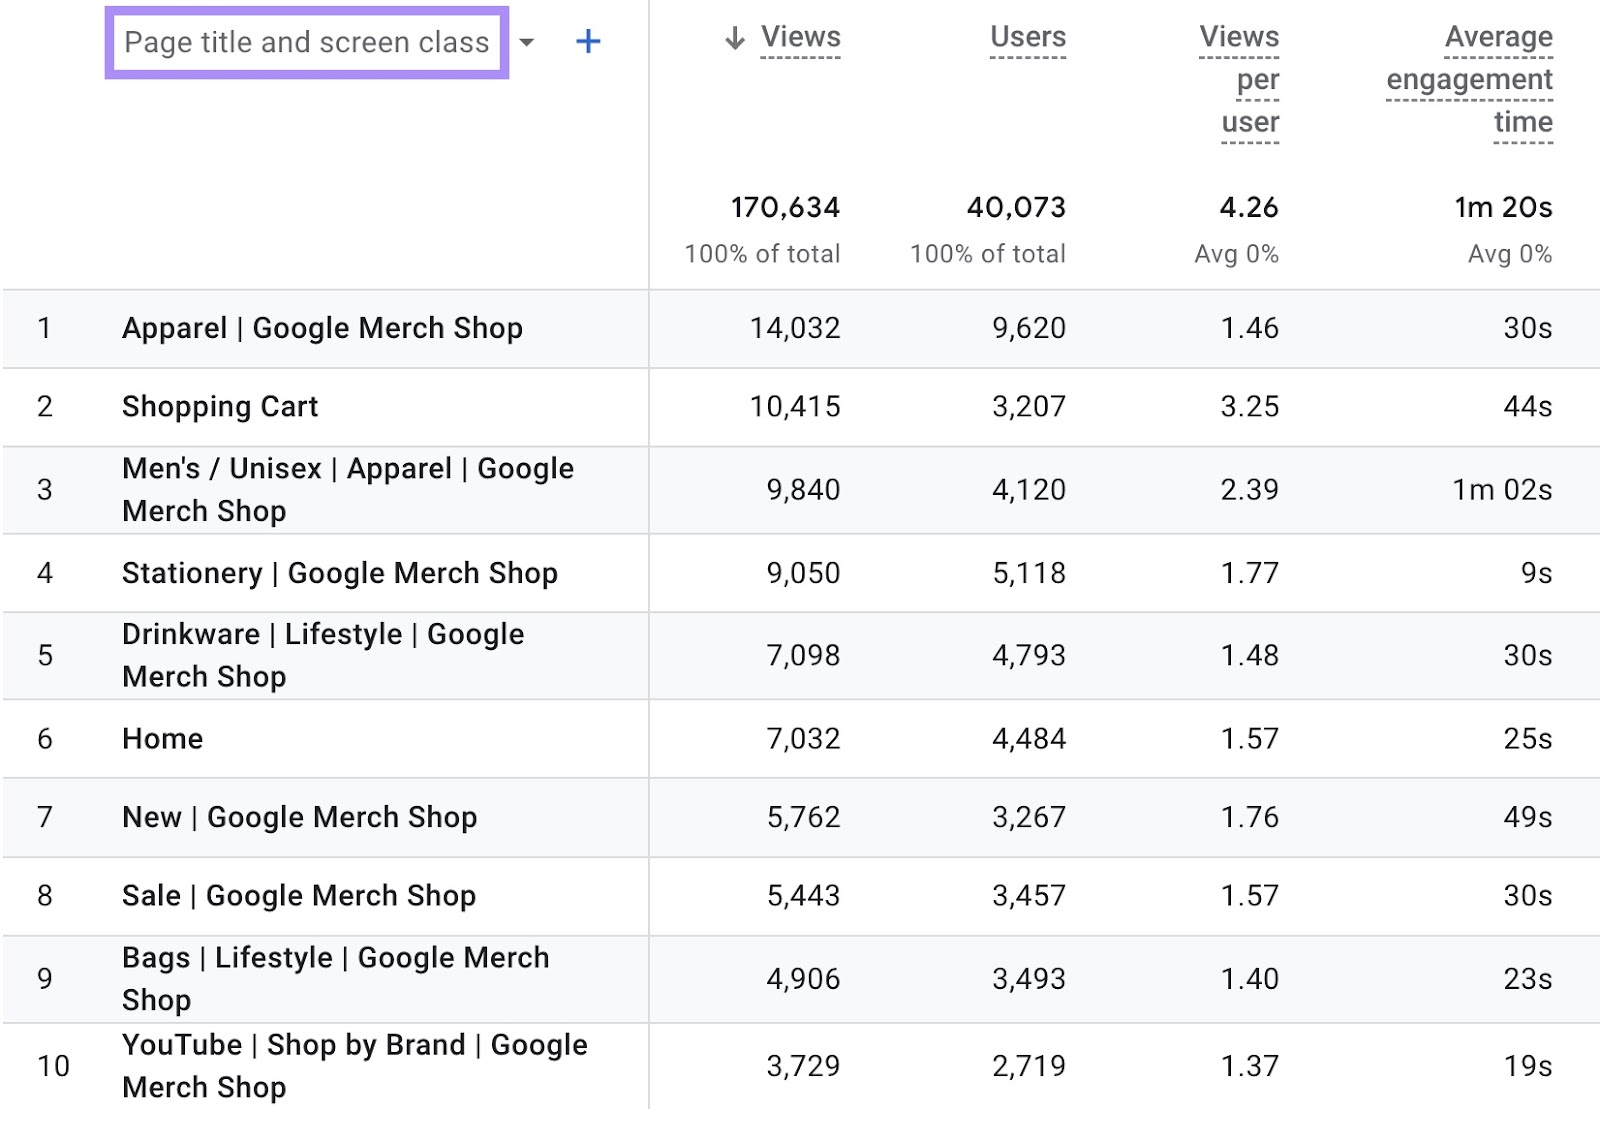
Click “Page title and screen class” in the dialog box that appears. Your report now looks like this:
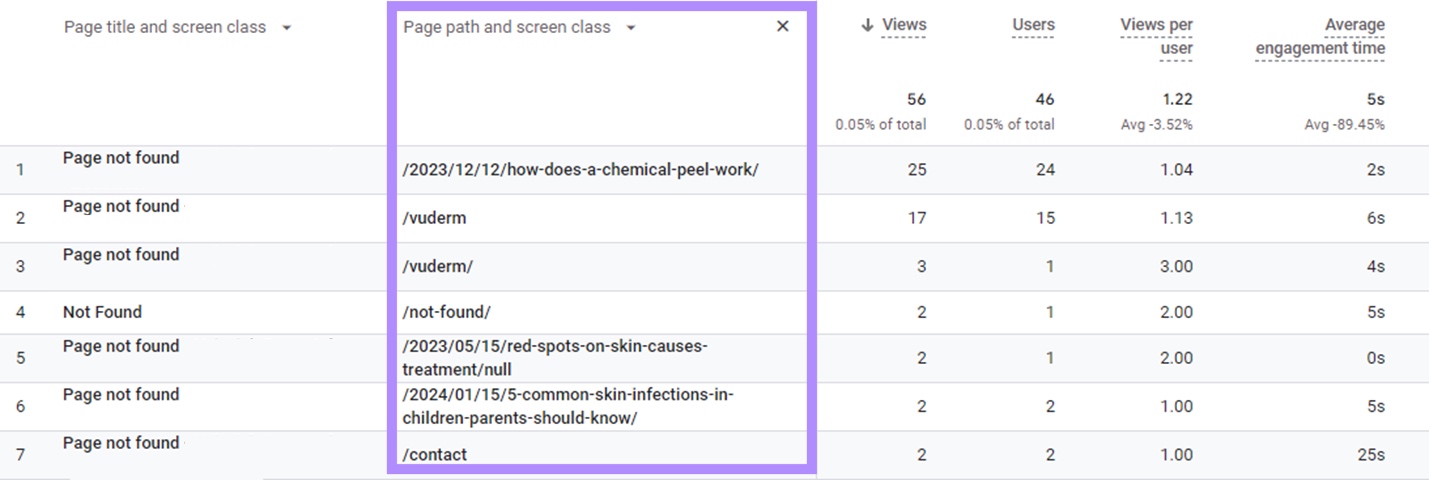
Now, type “not found” in the search field and hit “Enter.” You’ve now isolated your 404 pages. To find their URLs, click the blue “+” sign to add a secondary dimension to your report.
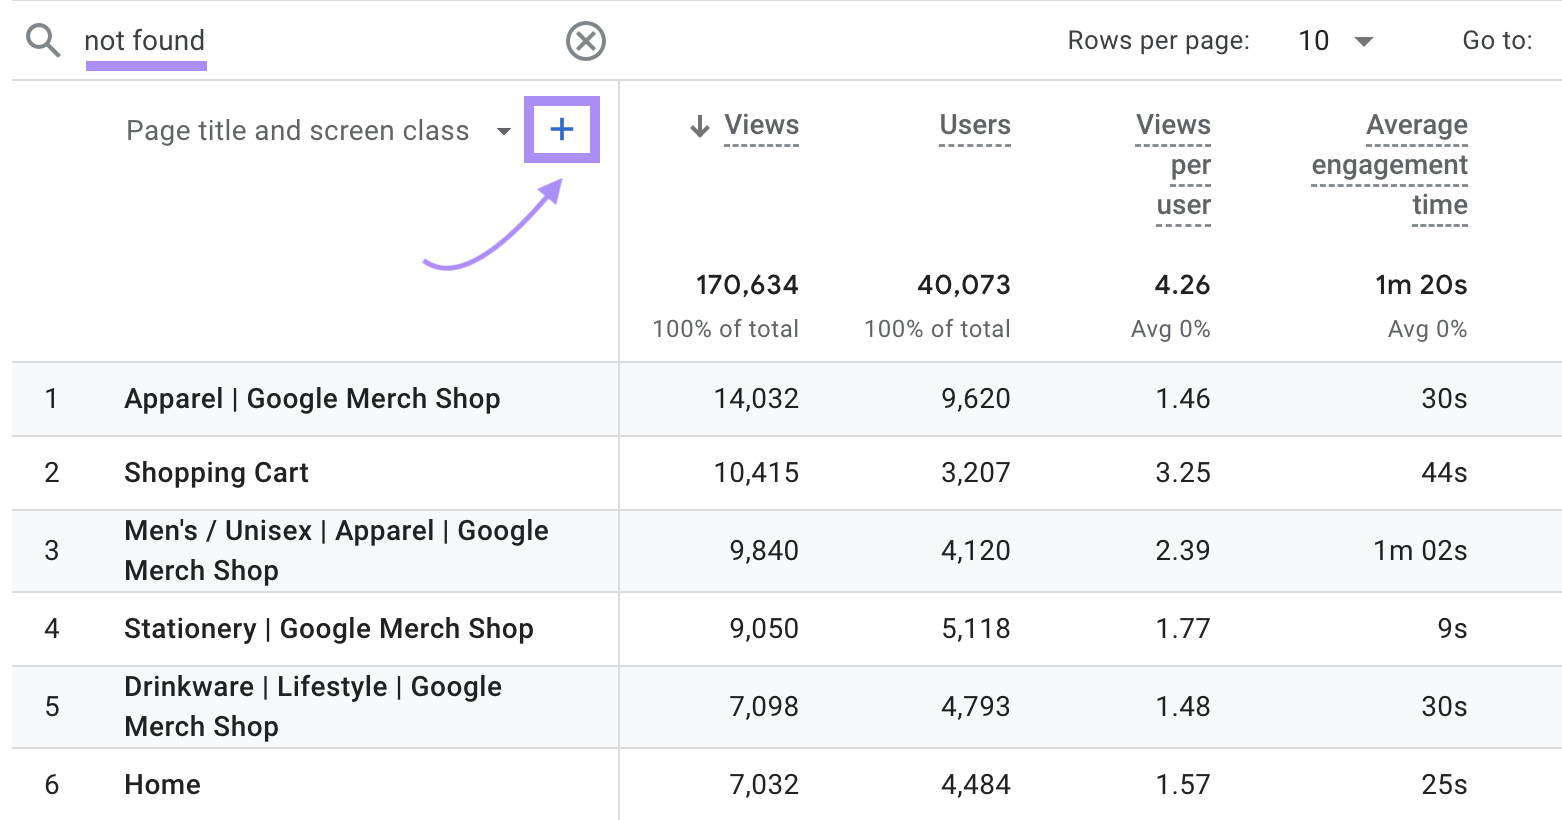
Click “Page path and screen class” in the dialog box that appears next. You’ve now identified the problematic URLs.
Fixing issues like these helps make your site more attractive to Google and humans. To help improve your rankings and SEO results.
You can use Semrush’s Site Audit to quickly identify your 404 pages. The tool also detects missing title tags, duplicate metadata, broken links, and other errors.
Further reading: Find out the differences between Google Analytics and Semrush, plus the added benefits of using the latter to improve your site’s performance.
How to Build a Google Analytics SEO Custom Report
You can use Google Analytics Explorations to customize your report for actionable SEO insights.
With Explorations, you select only the dimensions and metrics you need. You can even build your own segments to analyze organic search traffic.
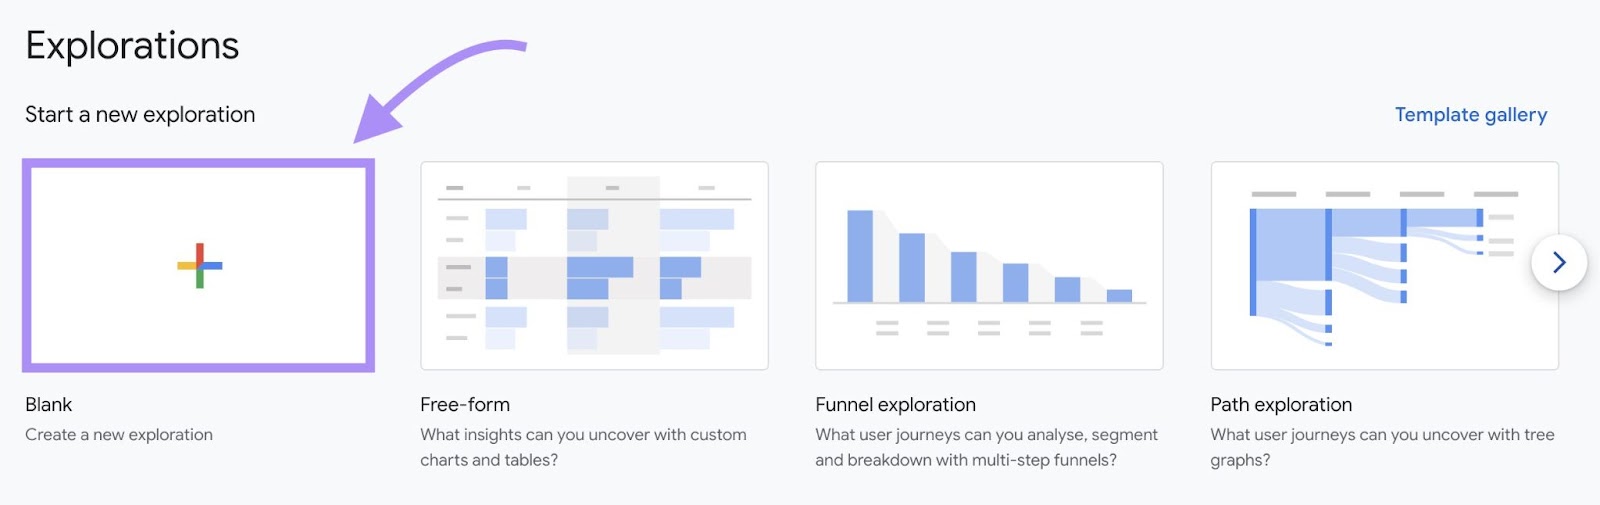
To get started, click on “Explore.” Then, click “+” to create a new “Blank” exploration.
You’ll be able to add specific segments, dimensions, and metrics you want in your custom report. A segment is a subset of your Google Analytics data.
Let’s explore how you can create a custom segment to view all your site visits from organic search.
Click the “+” sign to begin.
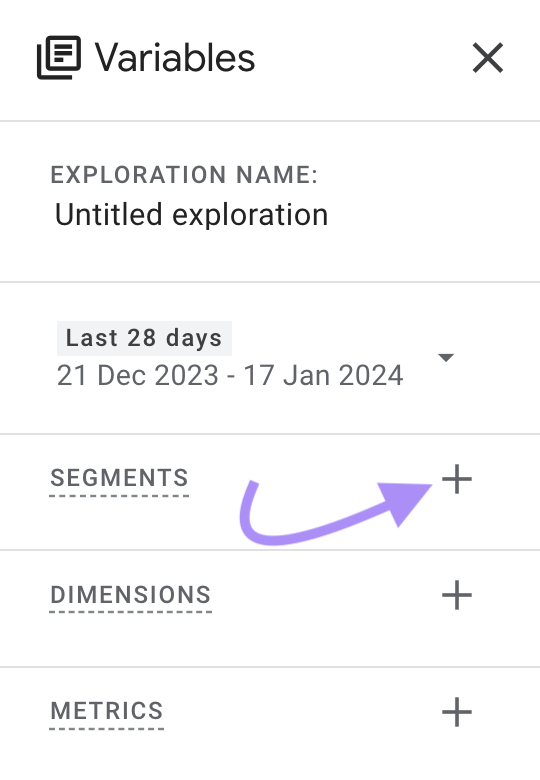
Click “Session segment” from the custom segment options.
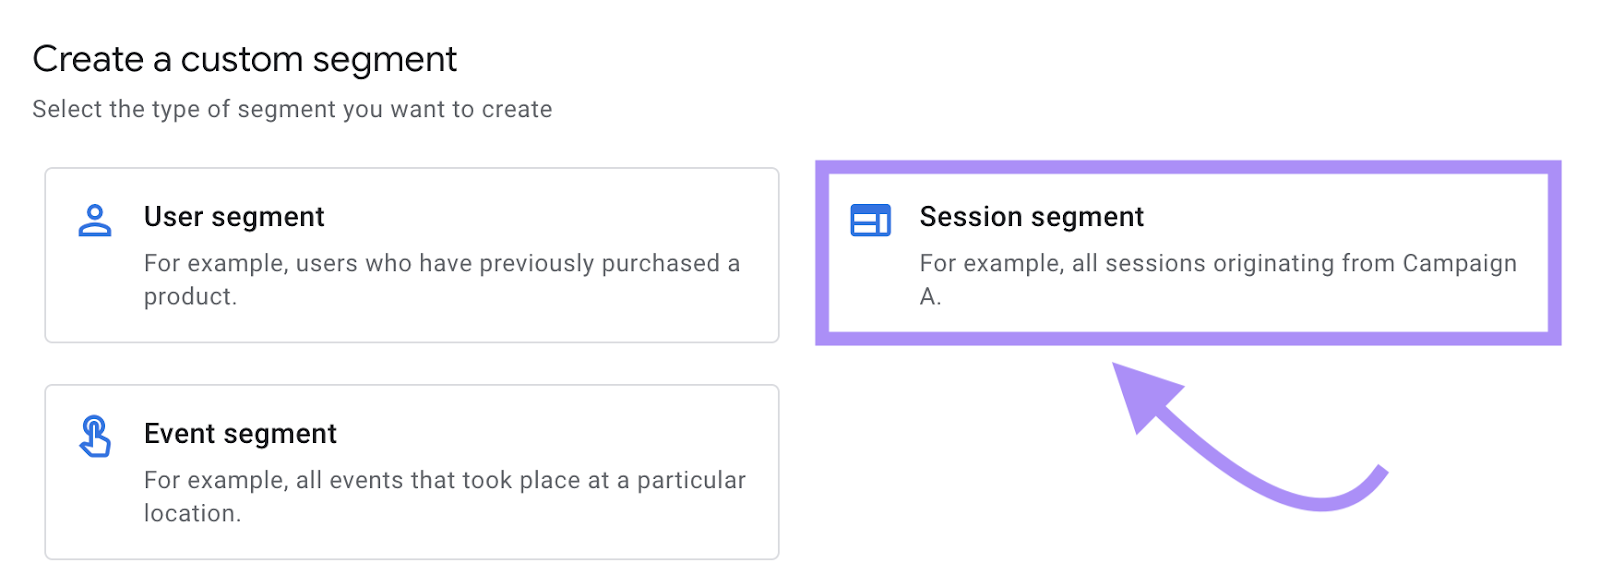
The segment builder will appear.
Enter a name for your segment in the “Untitled segment” field. A name like “Sessions from Organic Search” works great for our example. Then, click into the “Add new condition” field.
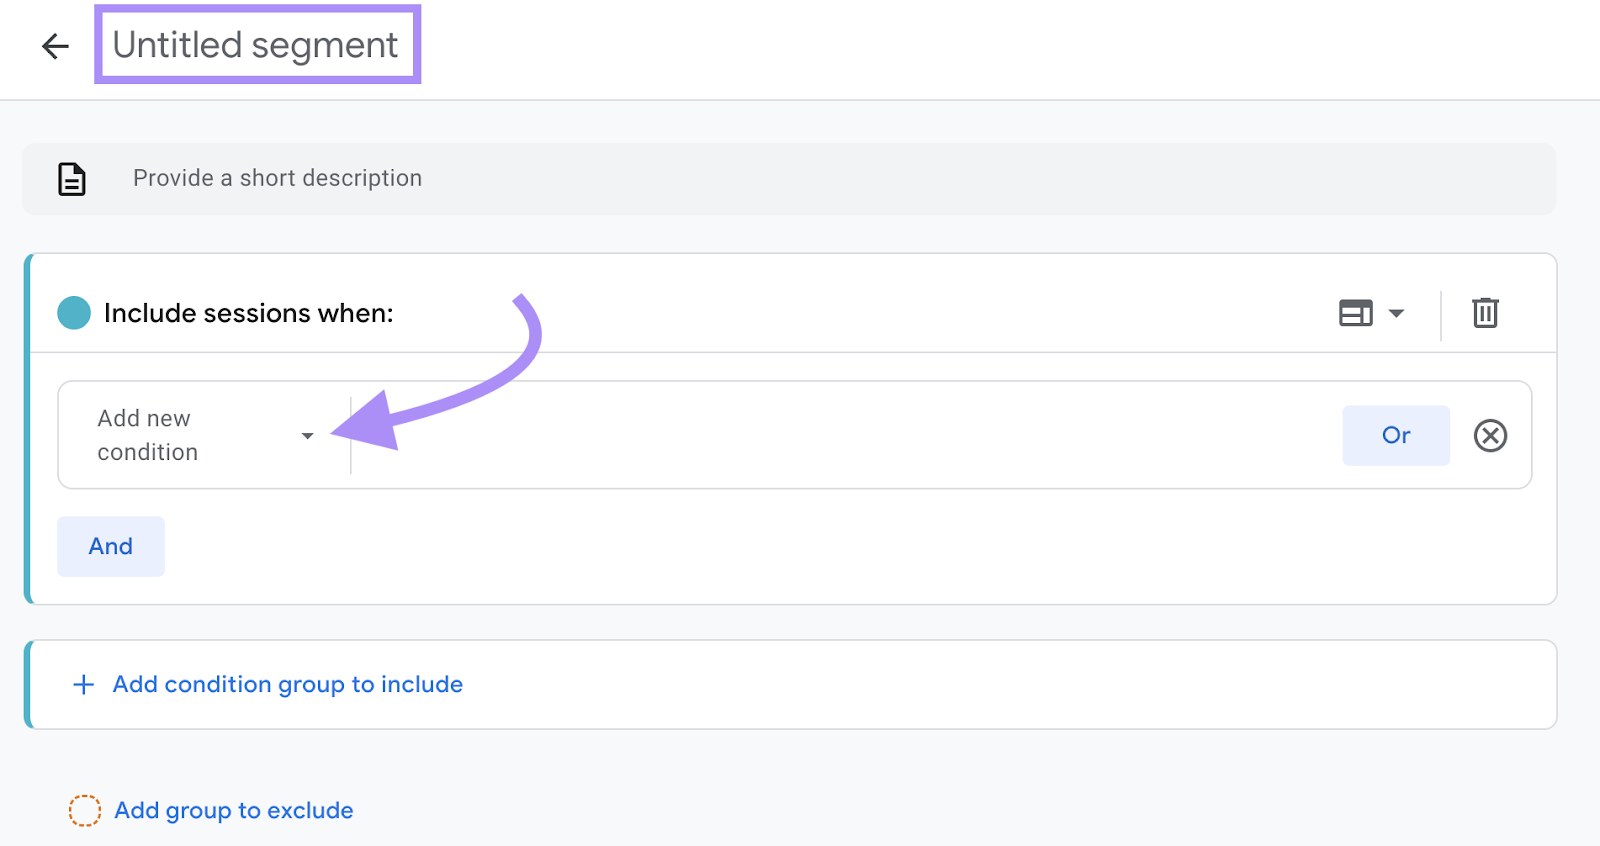
You’ll see a searchable dialog box pop up.
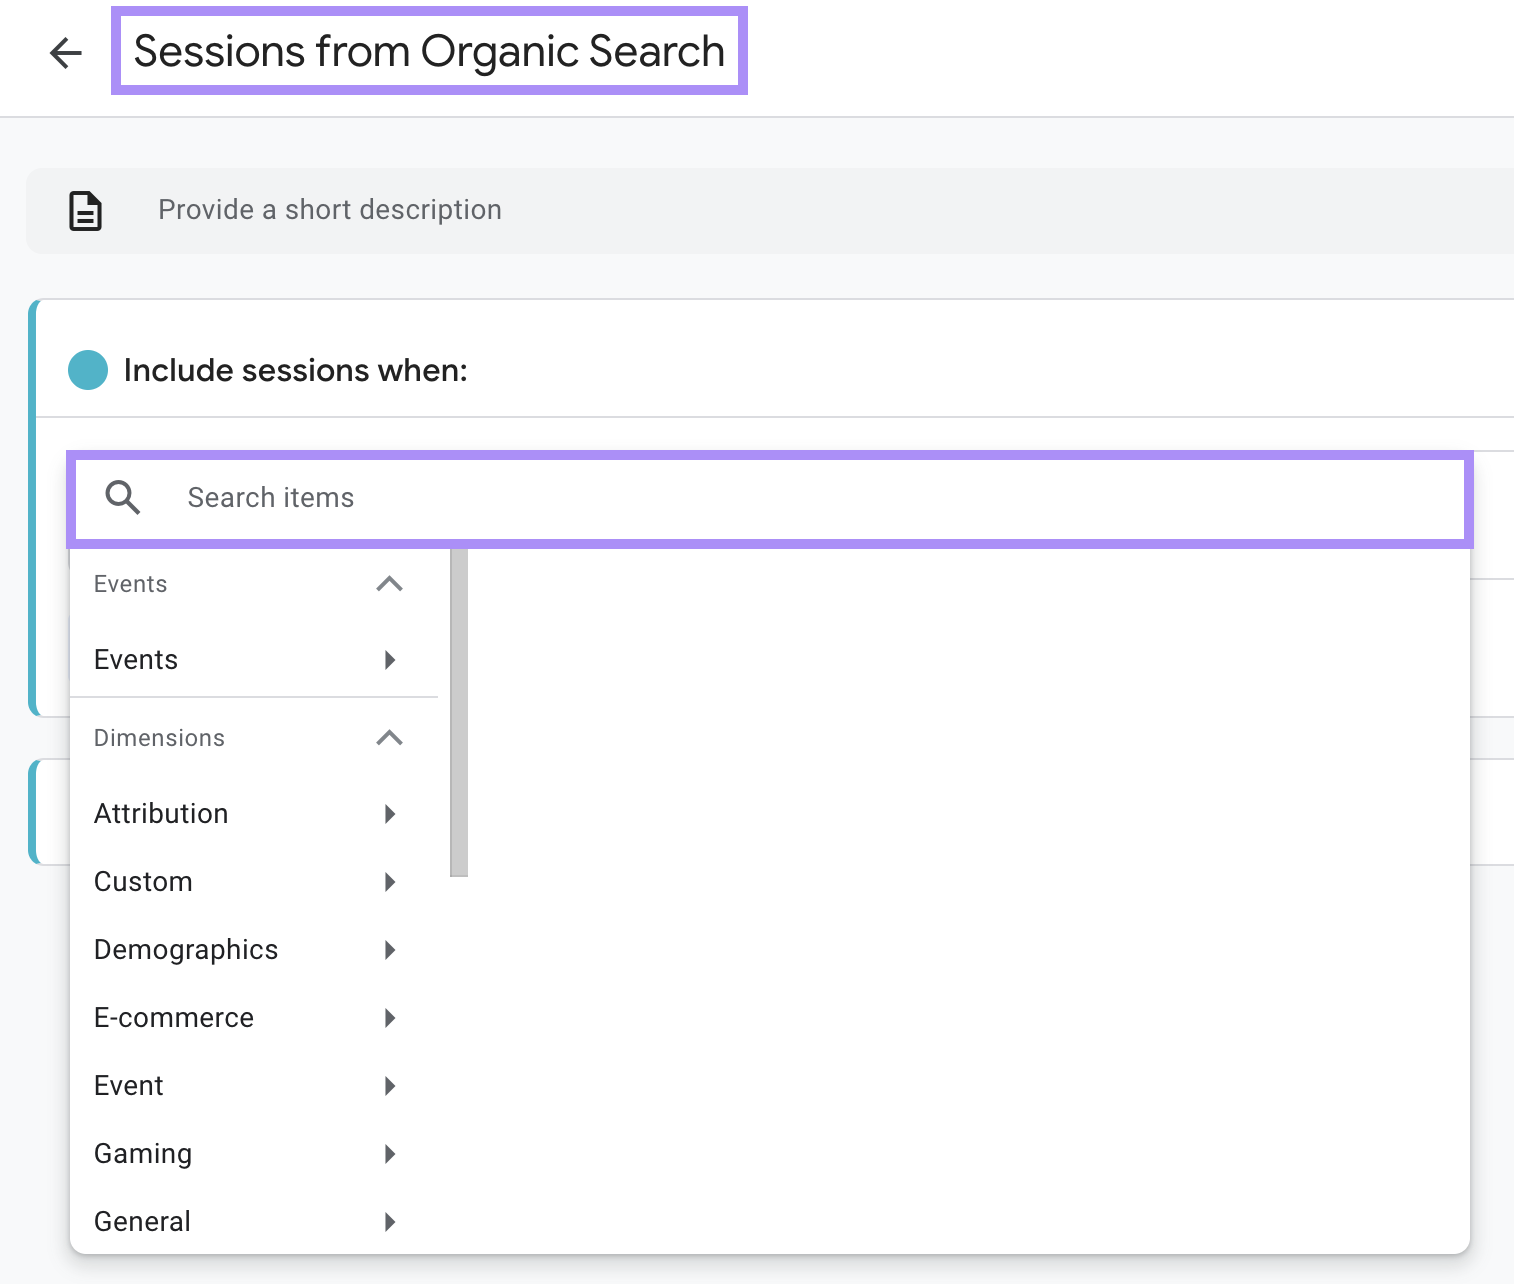
Next, you’ll need to create a segment of sessions that come from the Organic Search channel. Start typing “session default channel group” in the search field, and select that dimension from the list.
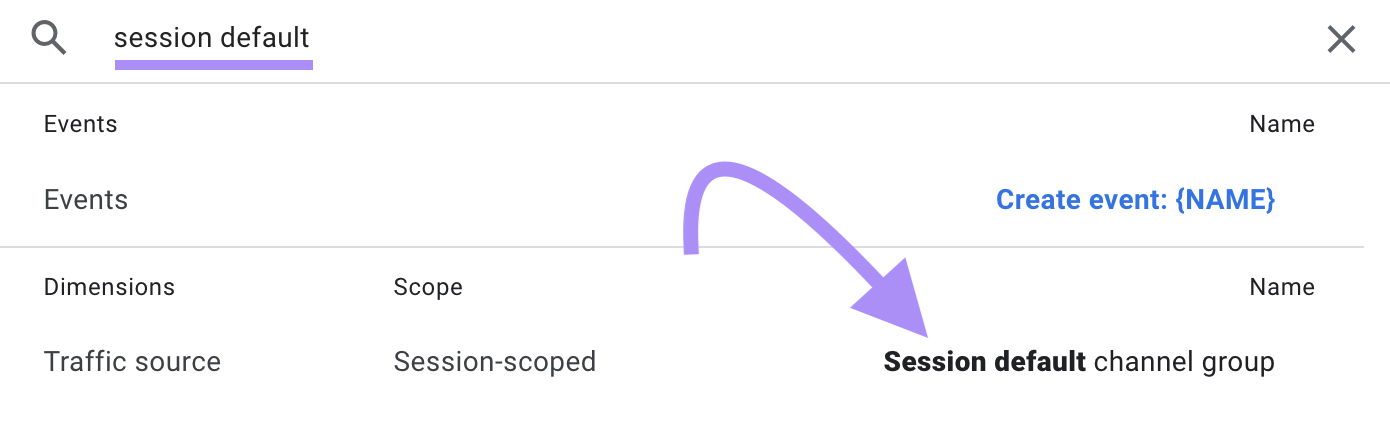
Now, click the “Add filter” button.
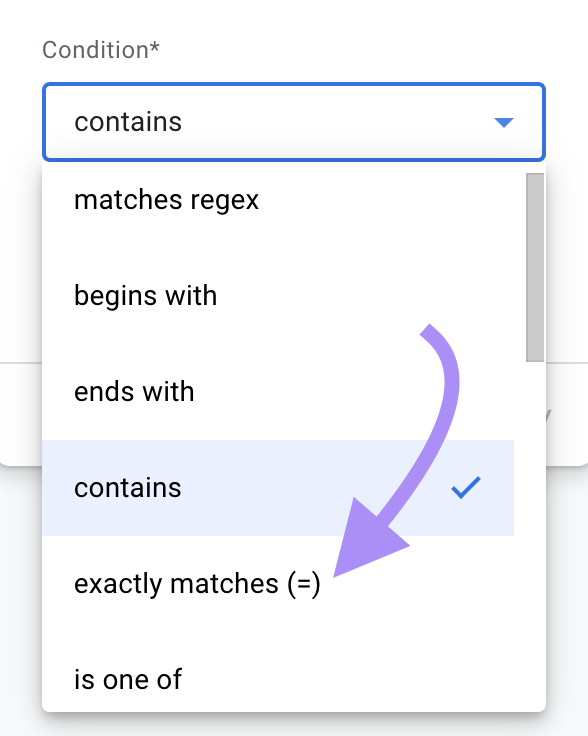
This filter works just like the others we’ve outlined in this guide. For our purposes here, proceed to change the condition from “contains” to “exactly matches (=).” Like this:
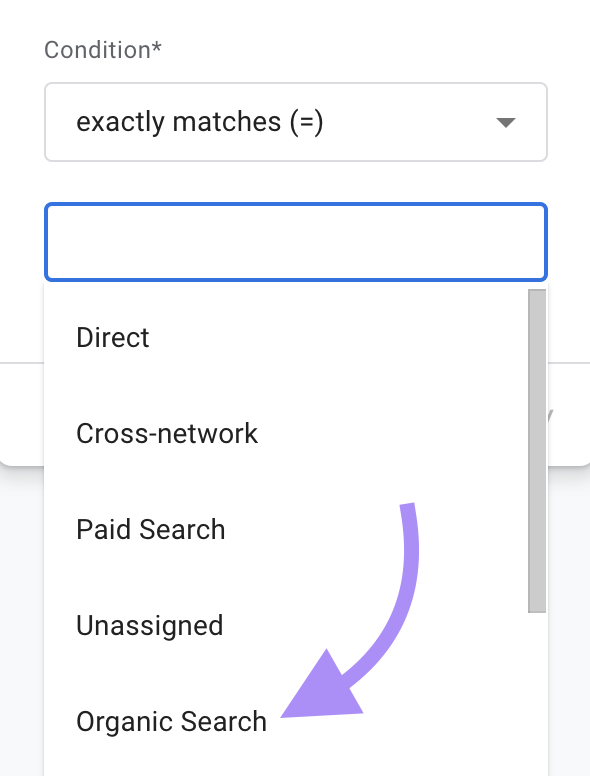
Now, choose “Organic Search” from the drop-down list.
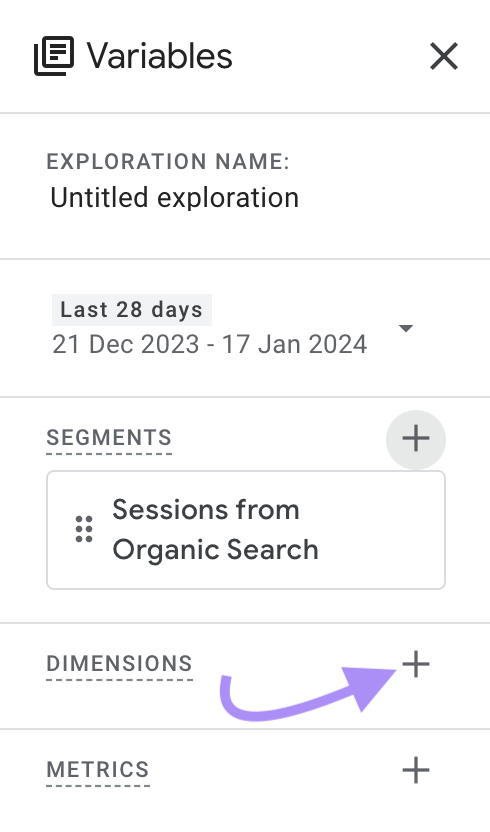
The segment builder will show a preview of your segment to the far right. You can see that this particular segment includes 29k sessions from 20k unique users.
Click “Save and apply” to finish.
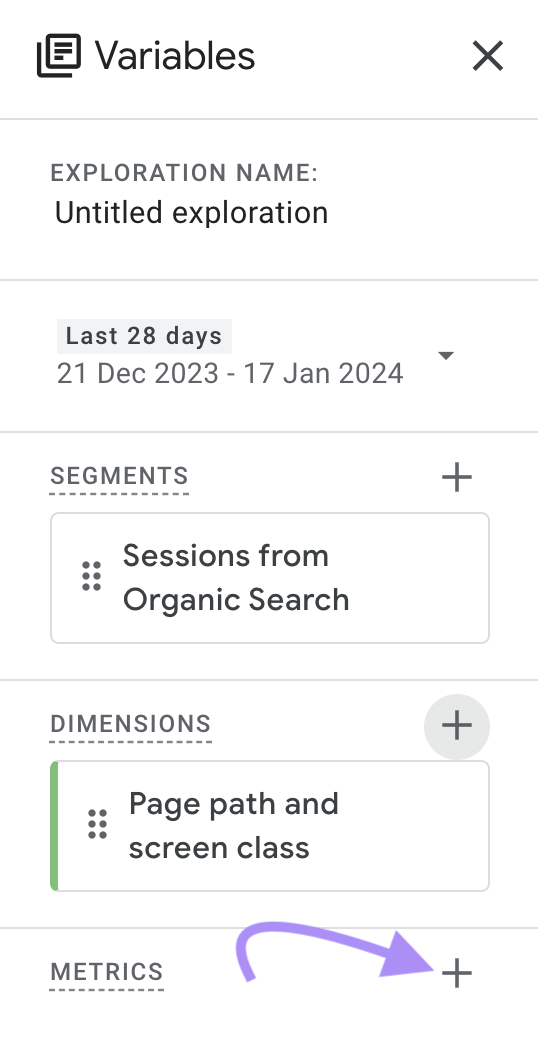
Once you’ve added your segments to your custom SEO report, click the “+” sign to the right of “Dimensions” to add page-level detail to your report.
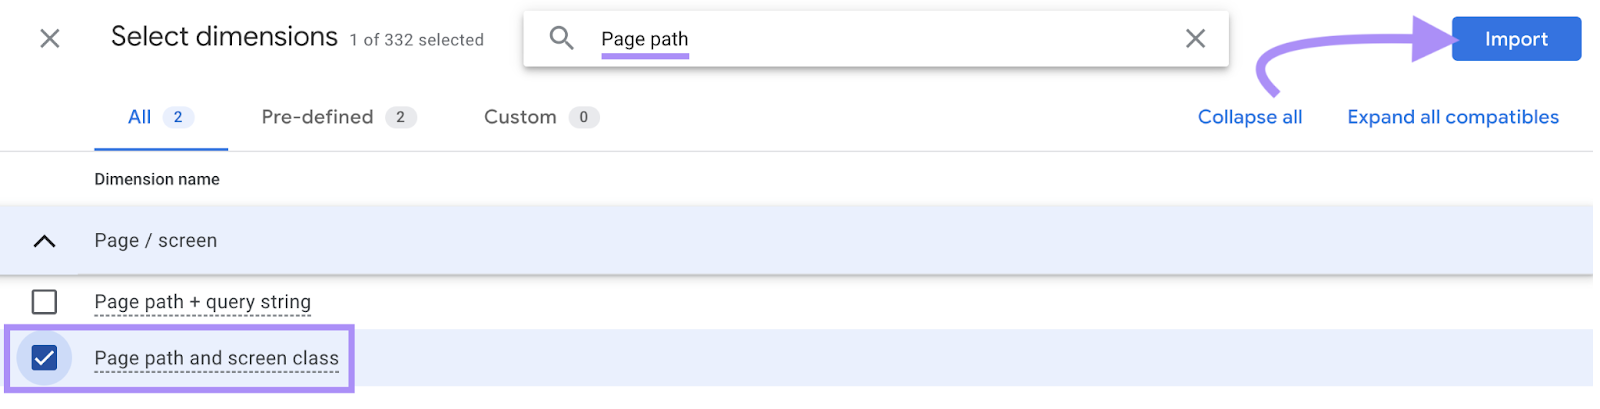
You’ll see a searchable window where you can import any available dimension. Let’s add the “Page path and screen class” option.
Begin typing “Page path and screen class” in the search field and check it when it appears. Click “Import” next to add it to your report.
Next, we’ll add metrics to the report. Click the “+” sign next to “Metrics”—like this:
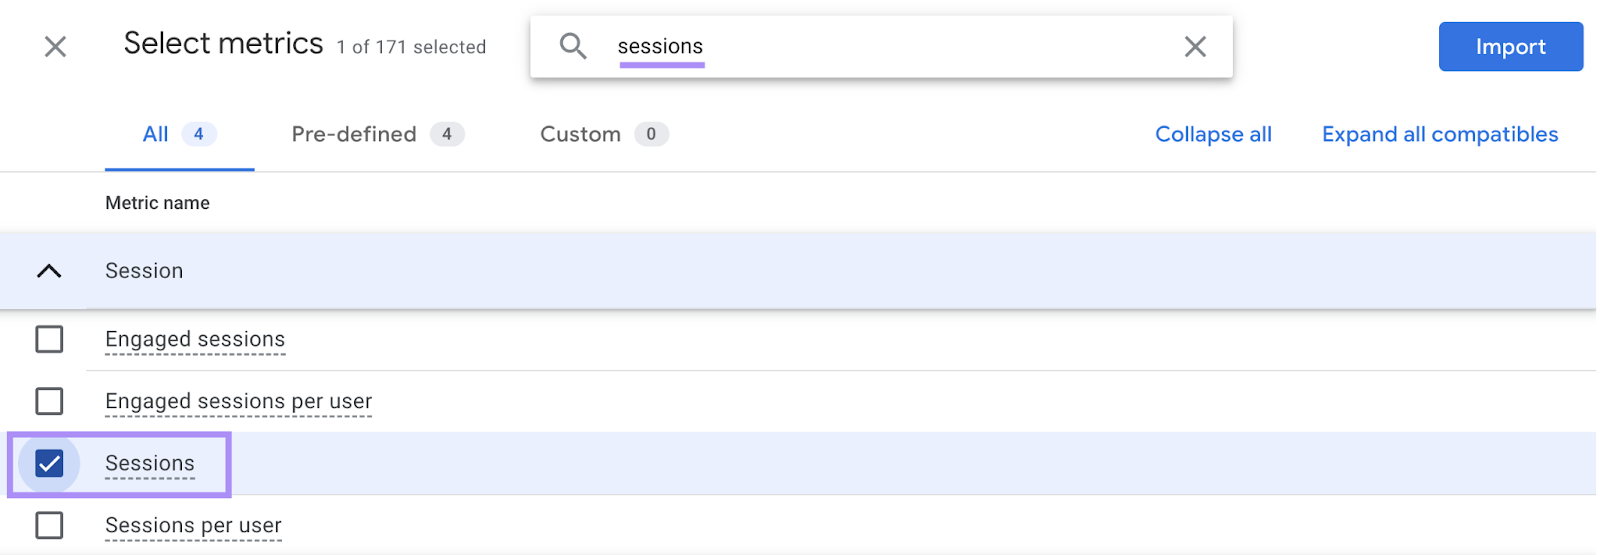
Search for “sessions” and select the metric via the checkbox.
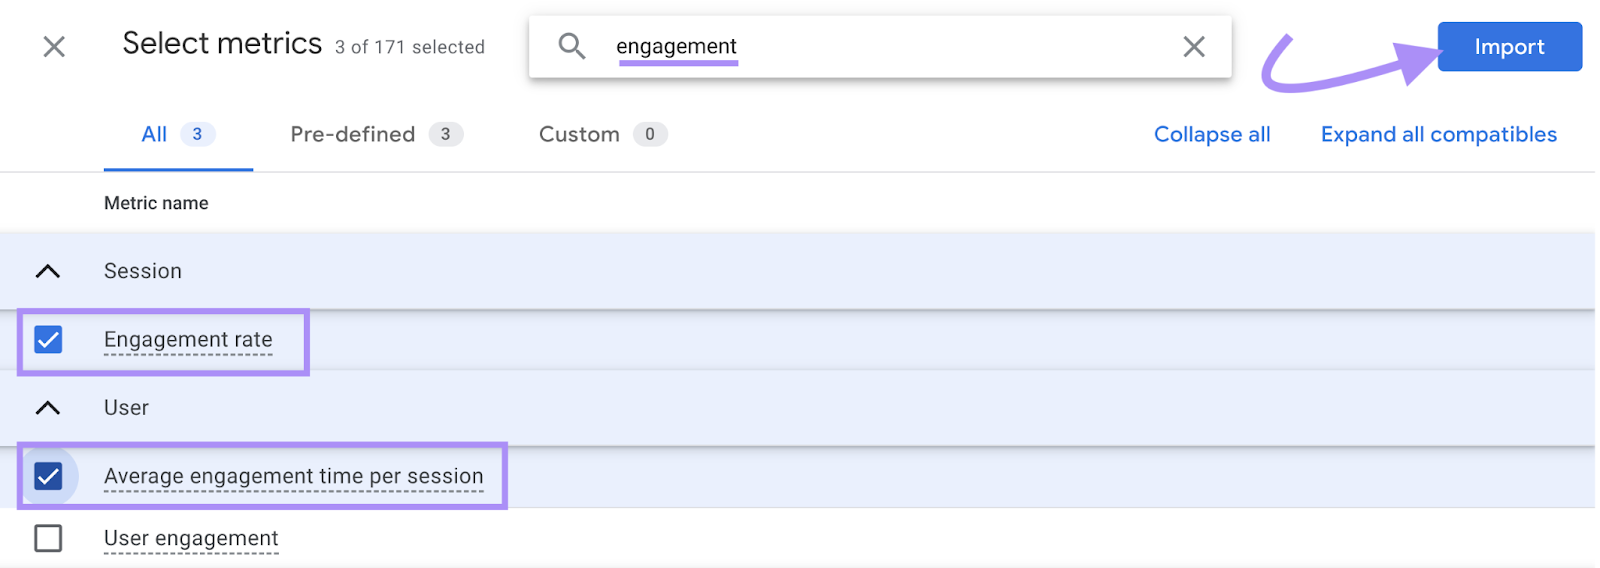
Now, begin typing “engagement.” Select both “Engagement rate” and “Average engagement time per session” from the list of metrics that appears.
Click “Import” to add all three metrics to your report.
There are two final quick steps before you analyze your data.
Give your Exploration a name. Then, double-click on your three metrics and your dimension to add them all to your reporting view.
Let’s now see how you can actually use this new custom report.
Uncovering Opportunities with Your Custom SEO Report
Your new report can help you identify high-opportunity pages. So you can improve your existing SEO content and learn lessons you can also apply to future articles.
Let’s focus on three distinct opportunities.
- Identify a page to review CTA (call to action) placement to make sure you’re giving readers a chance to see and click it
- Find a page that may need a new title, meta description, and introduction to better engage readers
- Pinpoint the best-performing content that you can use to improve your other articles
Review Page CTA Placement
Your top page has a higher engagement rate than average (81.08% vs. 80.47%). But an average engagement time per session that’s 26.8% lower than average (41s vs. 56s).
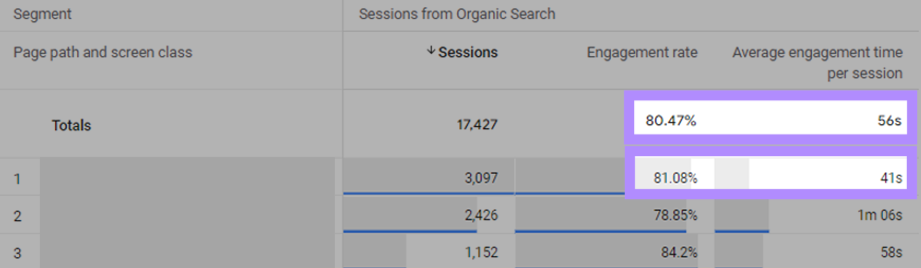
You know this page is performing well with search engines, based on the high session count. And you feel good about the introduction, based on the high engagement rate.
But your lower engagement time per session may mean your readers aren’t making it very far down the page.
You could review the placement of your CTA and move it further up so it’s highly visible. You may also strategically revise your content to try and hold your readers’ attention for longer.
New Page Title and Meta Description
Your 14th-ranked page has the lowest engagement rate of all the pages shown. Something is causing more of your readers to exit the page quickly.
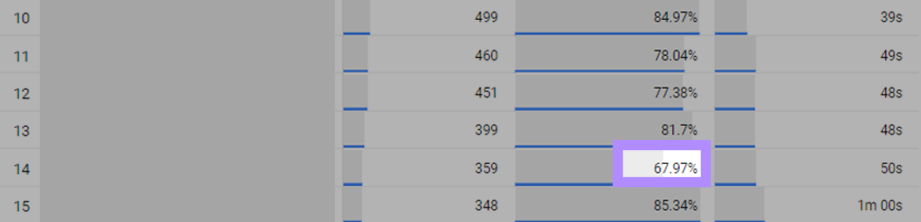
You may decide to revise your introduction, title tag, and meta description. To make it more likely that search engines show an accurate page preview, and that your introduction clearly states the page’s purpose.
A Highly Engaging Page That Might Help More Readers
Your 15th-ranked page has the highest engagement rate, plus a higher average engagement time per session than the average.
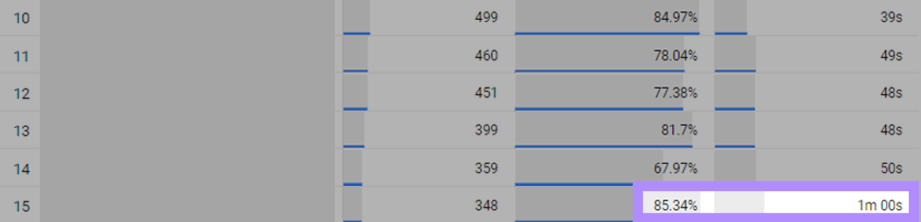
You can see this page is useful and relevant to your readers, and wish to create more like it. You review the page and find that it’s about the “source / medium” traffic dimension in Google Analytics.
You don’t want to make major changes to it that could harm page performance. But you also want to be open to new relevant subheadings that could improve the current piece and target other valuable keywords.
You can use Semrush’s Organic Traffic Insights to review keyword performance and look for more search terms you can optimize for. Here’s an easy opportunity you can spot for your article:
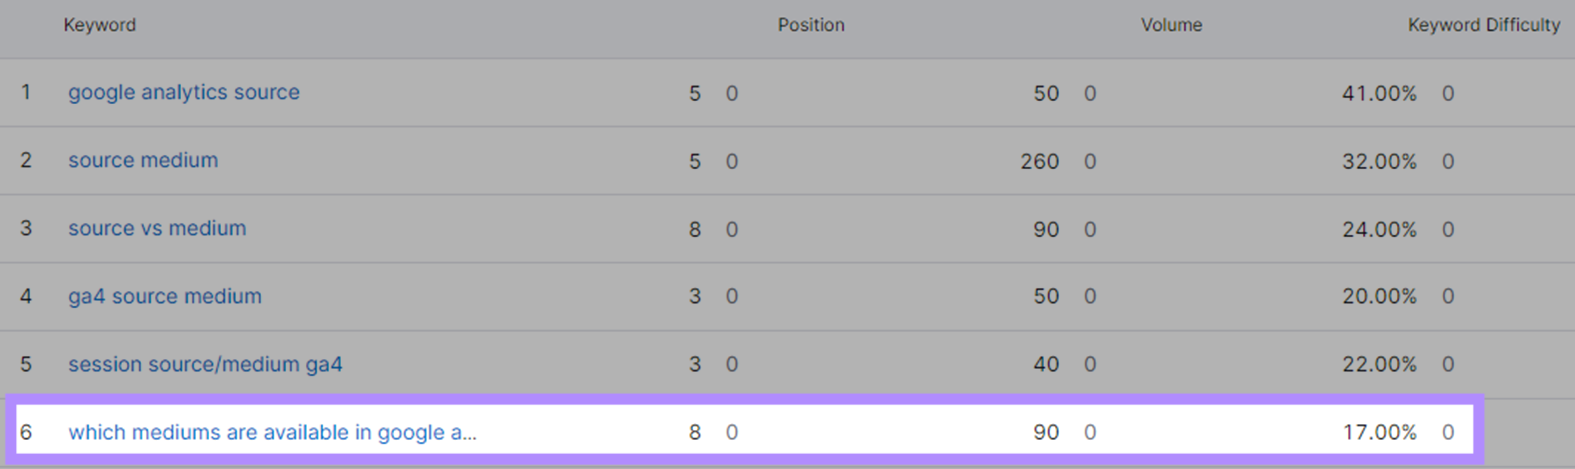
The keyword “which mediums are available in google analytics” is highly relevant to your topic, even though your article doesn’t address that precise question. And you can see your page is already ranking in the 8th position in Google for the term.
You may decide to add a subheading that asks and answers that specific question in your article. Given the search term’s low keyword difficulty, including it in your content may well be able to drive more traffic.
More Ways to Improve Your SEO Performance
You’ve now learned how to report SEO in Google Analytics. But what can you do beyond that to boost your site’s organic performance?
Get even more actionable insights with Semrush.
Semrush integrates with Google Analytics and Google Search Console to get your most important data in a single place. It also gives you a complete SEO Report Card as soon as you get set up.
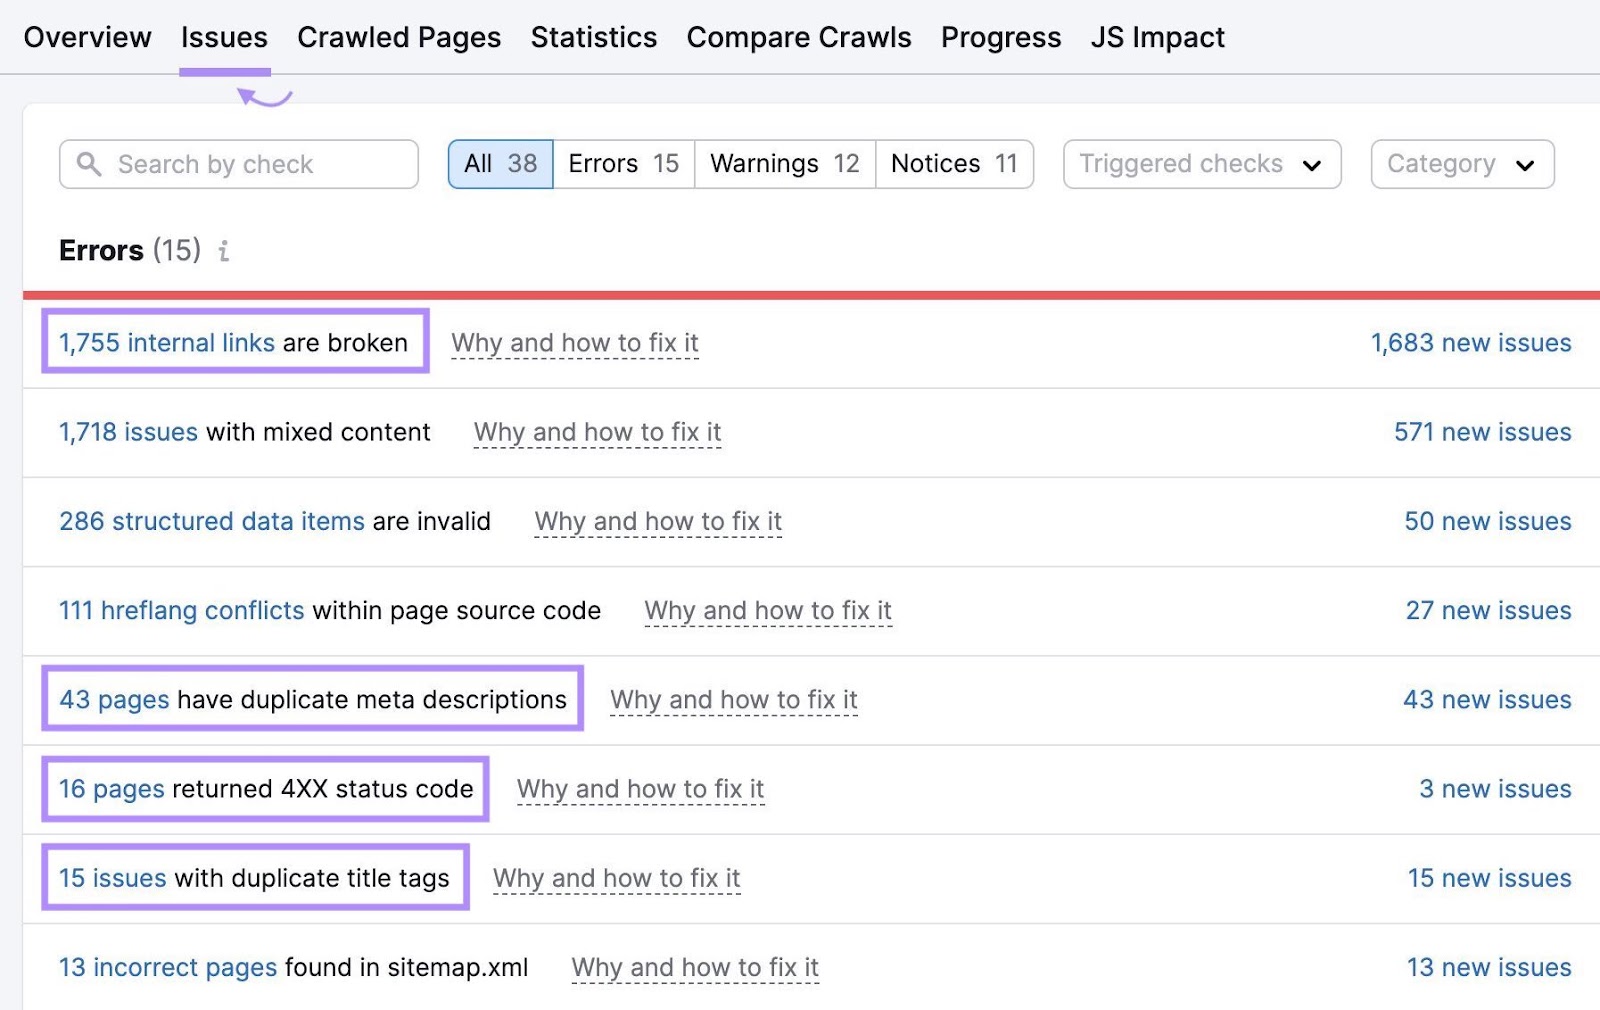
Like this one from Site Audit:
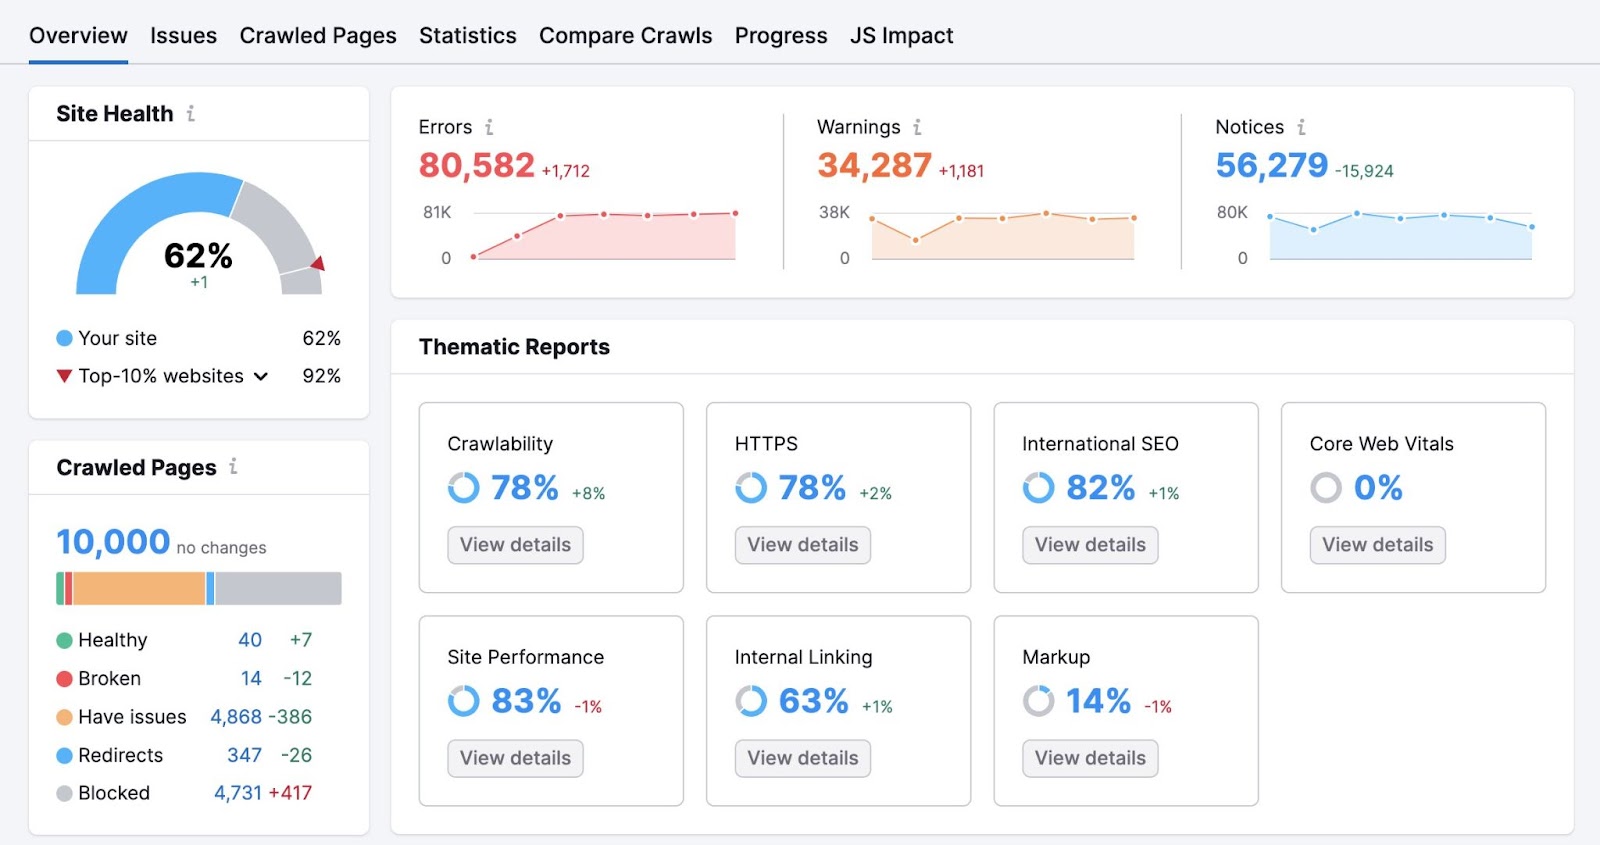
Use it to scan any website for more than 140 site health and SEO issues. So you can quickly move from identifying issues to fixing them.
You’ll instantly get a clear picture of where your site stands. And what SEO improvements to prioritize for the future.
With Keyword Magic Tool, you can uncover new keywords to target as part of your SEO plan.
You’ll also be able to create and share automated SEO progress reports to update your team once your strategy launches. That’s where the My Reports solution comes in.
Semrush tools can seamlessly power your SEO creation and management. So you can focus on the bigger picture. Sign up for a free trial.
[ad_2]
Source link